
STEP Matters 201
- Default
- Title
- Date
- Random
- Western Sydney University and the University of New England have set up a Citizen Science Project called the Dead Tree…Read More
- STEP has supported the Threatened Species Children’s Art Competition since 2017. The competition has been a great success and has…Read More
- The NSW Threatened Species Scientific Committee, established under the Biodiversity Conservation Act 2016, has made a Final Determination to list…Read More
- We are very pleased to announce that the John Martyn Research Grant for 2019 has been awarded to Gabriella Hoban.…Read More
- The final deadline was set at 31 May for submissions on the Hills Council’s applications to the NSW government to…Read More
- The transport sector is Australia’s second fastest growing source of carbon dioxide emissions and yet we still don’t have any…Read More
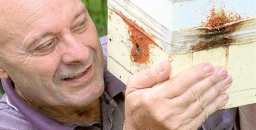
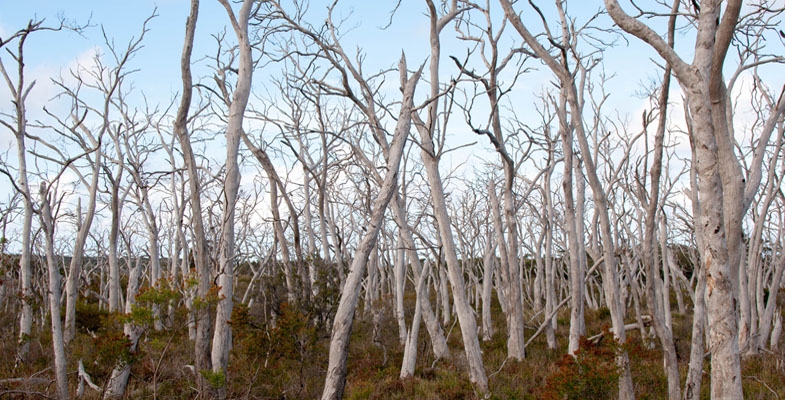
- The costly problem of ash dieback has been highlighted in New Scientist. This fungal disease caused by Hymenoscyphus fraxineus was…Read More
- When the USA became serious about WWII they brought about an amazing mobilisation of their entrepreneurial industrial potential. That is…Read More
- Visiting Tasmania at leatherwood flowering time in February was a nice experience apart from the weather. It has a perfumed…Read More
- In May 2019 the Intergovernmental Science-Policy Platform on Biodiversity and Ecosystem Services (IPBES) published its global assessment of the state…Read More
- Our walk in Fox Valley on 14 April revealed some surprises. A Powerful Owl was spotted and there were several…Read More
- We welcome Peter Clarke as a new member of the committee. He is well known for his work with Ku-ring-gai…Read More


Citizen Science Project - Dead Tree Detective
Western Sydney University and the University of New England have set up a Citizen Science Project called the Dead Tree Detective.
The aim of the project is to collect observations of dead or dying trees around Australia. It sounds a bit grim, but knowing where and when trees have died will help us to work out what the cause is, identify trees that are vulnerable, and take steps to protect them.
This project will allow people Australia-wide to report observations of tree death. In the past, there have been many occurrences of large-scale tree death that were initially identified by concerned members of the public such as farmers, bushwalkers, bird watchers and landholders. Collecting these observations is an important way to monitor the health of trees and ecosystems.
All you need is a smart phone with a camera and GPS. It is also possible to report on paper by asking for a survey form by emailing This email address is being protected from spambots. You need JavaScript enabled to view it..
The leader of the project, Prof Belinda Medlyn wants to get better data about how trees respond to drought.
How our native plants cope with these changes will affect (among other things) biodiversity, water supplies, fire risk and carbon storage. Unfortunately, how climate change is likely to affect Australian vegetation is a complex problem, and one we don’t yet have a good handle on.
Threatened Species Children’s Art Competition
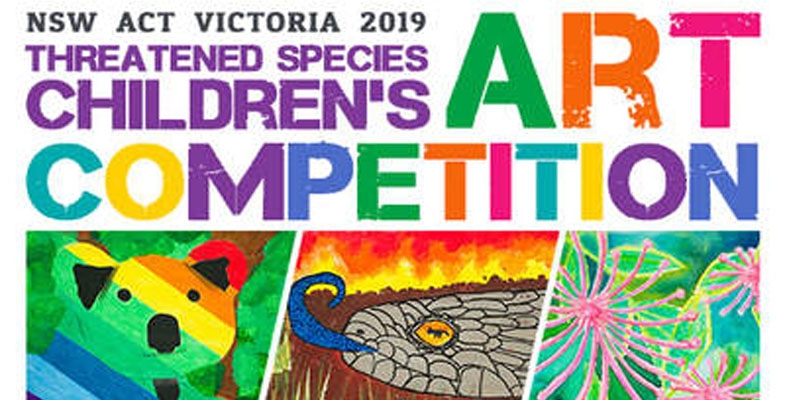
STEP has supported the Threatened Species Children’s Art Competition since 2017. The competition has been a great success and has now expanded to Victoria, and other states are expressing interest.
Administration has now been taken over by the Humane Society International – the largest worldwide charity caring for animals.
Children choose a threatened native species, then create a drawing or painting of it with an accompanying short explanation of their work. Entries close on 2 August 2019.
Seventy NSW finalists will be chosen for a two-week exhibition in Sydney, with winners announced at Parliament House Sydney on 6 September 2019.
Sydney Turpentine-Ironbark Forest Declared Critically Endangered

The NSW Threatened Species Scientific Committee, established under the Biodiversity Conservation Act 2016, has made a Final Determination to list Sydney Turpentine-Ironbark Forest (STIF) in the Sydney Basin Bioregion as a critically endangered ecological community. This classification already applies under the federal Environment Protection and Biodiversity Conservation Act.
The highest threat category is now applied because STIF has experienced large:
- reductions in geographic distribution
- degrees of environmental degradation
- disruptions of biotic processes and interactions
There is an estimated 2,940 ha of STIF remaining, or less than 10% of the estimated original distribution.
Remnants of STIF are poorly represented in the formal reserve network, and unreserved areas are subject to the threat of vegetation clearing. The total area under reservation is estimated to be 570 ha, equivalent to less than 2% of the estimated pre-1750 distribution or 20% of the remaining extent.
Remnants of STIF have historically been subjected to a range of anthropogenic disturbances including logging, grazing by domesticated livestock and burning at varying intensities.
Remnants are typically small and fragmented and are susceptible to continuing attrition through clearing for routine land management practices due to the majority of remnants being located in close proximity to rural land or urban interfaces.
Applications to the NSW Land and Environment Court demonstrate that there is ongoing pressure to clear STIF in the course of developing private properties or for the establishment of asset protection zones.
STIF is subject to ongoing invasion by an extensive range of naturalised plant species. Weed invasion is exacerbated by the proximity of remnants to areas of rural and urban development and the associated influx of both weed propagules from gardens and nutrients contained in stormwater runoff, dumped garden waste and animal droppings.
John Martyn Research Grant Award for 2019
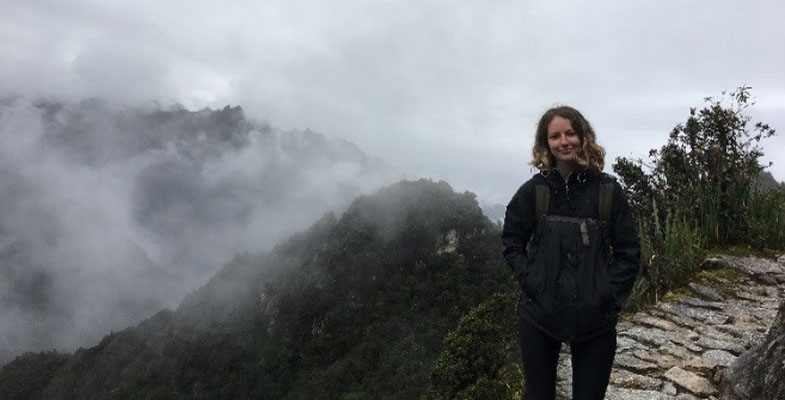
We are very pleased to announce that the John Martyn Research Grant for 2019 has been awarded to Gabriella Hoban. Gabriella’s research project is entitled Soil Characteristics as Indicators of Restoration Trajectories in Urban Woodlands. This subject is highly relevant to STEPs aims to restore degraded ecological communities.
She has provided us with this description of her project.
Hi! I’m Gabby. I am an honours student at the University of New South Wales. I love ecology, ecological restoration and conservation and have a slight obsession with plants.
For my honours project I will be studying the effect of soil characteristics on restoration trajectories in urban woodlands. My research will be based in western Sydney within the Cumberland Plain Woodland, a critically endangered vegetation community. In this region, a concentration of threatened species and ecological communities overlap with intense development pressure.
Through my project I aim to quantify the relationship between the abundance of exotic and native plant species in relation to soil constituents in bushland reserves with agricultural land use legacies. Soil samples will be collected and the effect of soil properties on restoration trajectories will be determined.
My research will build on existing data from long-term study sites established in 1989. This research provides an exciting opportunity to examine long term trends in regenerating bushland.
I hope this research can inform conservation efforts not only at this site, but also similar grassy reserves recovering from legacies of former agricultural land use that span a large area across south-eastern Australia.
Thank you to STEP and its members for the opportunity.
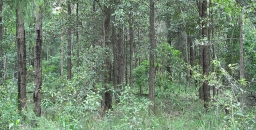
Last Attempt to Stop the Mirvac Development Plans for the IBM Site

The final deadline was set at 31 May for submissions on the Hills Council’s applications to the NSW government to change the zonings in their local environment plan and insert some special provisions in the development control plan. These changes will facilitate development on the land owned by Mirvac that currently contains the old IBM corporate headquarters on the corner of Coonara Road and Castle Hill Road in West Pennant Hills next to the Cumberland State Forest.
The basic framework of the proposals is unchanged from earlier plans described in STEP Matters (Issue 198). The main purpose of the council application at this stage is to facilitate the development of 600 dwellings. Ancillary aspects are that, if the housing development proceeds, Mirvac will sign a voluntary agreement to allow the existing playing field on the land to become public open space and pay for the development of a soccer field with synthetic turf and the necessary public access road.
The design of the housing development will be subject to further scrutiny at the development application stage but if these current plans are approved, the basic framework will be set in concrete (lots of it!).
Even though part of the site is currently developed as a corporate park, these buildings are surrounded by mature tree plantings. The majority of the site is classified as Blue Gum High Forest or Sydney Turpentine-Ironbark Forest, both critically endangered. This is a unique opportunity to preserve one of the few remaining areas of high quality vegetation and its associated fauna habitat in north-western Sydney. Its proximity to Cumberland State Forest adds to the value of this preservation through its connectivity and boosting of resilience of the vegetation.
Hence STEP is opposed to the whole development proposal.
Future of the forested area
The future management of the large forested area that is to be zoned E2 (environmental conservation) which contains critically endangered ecological communities and fauna, is completely unknown. The development control plan amendment relating to the site refers to the residents as being responsible for the cost of maintenance of the 'significant vegetation'. This is totally unrealistic.
It is essential that a stewardship or conservation agreement be established defining responsibilities and funding of management together with a vegetation management plan. This should be in place before any dwellings are occupied.
As the E2 land will be for the benefit of the whole local community, not just the residents of the Mirvac developments, it is appropriate that the Hills Council be responsible for its management.
Synthetic playing field
The proposal for the synthetic playing field should not go ahead until the environmental impact of the use of this surface is thoroughly assessed. A detailed analysis is required of the impact on the bushland below the field of:
- stormwater runoff from the hard surface
- runoff of degraded synthetic grass and substrate pieces
- the loss of soil biota under the artificial surface
- the risk from a fire in the surrounding bushland spreading to the field
- conversely, the surface itself is mostly made of rubber and will be much hotter than in the surrounding vegetated areas, so what impact will this have on the bushland and wildlife?
Of course no floodlighting should be allowed so close to bushland that is home to several nocturnal species such as the Powerful Owl and several species of bats.
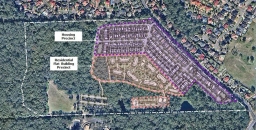
Development plans
The image at the top of the page shows the proposed layout of the development. The medium density housing area (200 dwellings) is along the edges of the site while the high density zone (flats up to six stories) is lower down next to the forested areas.
The main argument from Mirvac in favour of the development is its proximity to the new Cherrybrook Metro Station. Residents will however have to walk up a steep hill and cross Castle Hill Road to get to the station. The shortest possible walk is 800 m. The other side of Castle Hill Road which is in the Hornsby Council area is currently zoned low-density residential that will no doubt be planned for higher density development in the future as the station is now operating.
Overdevelopment
The major reason for objections to the proposals is the level of development. The residents of West Pennant Hills have rallied strongly against the proposals. Over 4,000 objections have been received by the Hills Council. They are concerned about the increase in traffic on already congested roads as well as the environmental impact of the development.
The main point is that the existing IBM corporate park is a valuable asset. The buildings should not be knocked down. With a bit of imagination alternative uses could be found that will not lead to destruction of the mature native vegetation that surrounds the buildings and the car park.
In any case the council and Mirvac have not demonstrated that there is a need for this huge housing area. We note that the Department of Planning document Cherrybrook Structure Plan: Vision for Cherrybrook Station Surrounds (September 2013) does not envisage any residential development on the site. Increases in housing are planned for neighbouring areas north and further west of Castle Hill Road with a total number of new dwellings planned of 3,200 by 2036.
The plan is an example of the notorious spot re-zonings that have plagued development in Sydney. A developer comes up with a plan that is outside the planning guidelines. The local council knocks it back so the developer is able to go directly to the Department of Planning to gain approval via the Gateway Process. The new planning minister, Rob Stokes, has stated that this system will not continue but we will have to see how that can come about.
As Hornsby Council says in their submission:
Any decision for this site should be deferred until a precinct-wide structure plan or strategy is adopted for all the land parcels surrounding the Cherrybrook Metro Station.
...
The proposal by Mirvac to redevelop the subject property for residential purposes is likely to trigger further owner/developer-led spot rezoning applications in the area. This would lead to an ad hoc approach to land use planning for the Metro Station precinct. The process would undermine the planning framework for both councils and lead to poor outcomes for the Cherrybrook community.
Housing plan is overdeveloped
The documents indicating the layout of the medium-density housing precinct show houses that are crammed together, some on blocks as small as 86 m2 that are only 4 m wide. Even with some of the wider lots most of the street will be taken up by driveway access.
There will be little space for street trees. The front and back yards will also be too small for trees to grow with a beneficial canopy.
The design of the subdivision needs to take account of the need for liveability of streets in the face of current heat in summer and expected increases with climate change.
There are also several other concerns about the details of the development and how it will impact on the surrounding forest. These relate to clearing of riparian zones and impingement of asset protection zones into the E2 area and Cumberland State Forest.
We have covered several of these concerns in previous comments on this proposal. They are very concerning but basically STEP is opposed to the development in its entirety.
Conclusion
Mirvac’s website reveals the company’s Biodiversity Policy. The policy states:
At Mirvac, we aim to be an overall positive contributor to environmental sustainability. We firmly believe that responsibly managing our biodiversity impacts will enable us to strategically assess biodiversity-related risks and opportunities and anticipate and respond proactively to emerging regulations and societal expectations.
Mirvac’s plans for the IBM site are clearly not compatible with their Biodiversity Policy.
Let’s Introduce Vehicle Fuel Efficiency Standards and Save Money Too
The transport sector is Australia’s second fastest growing source of carbon dioxide emissions and yet we still don’t have any standards which apply to new vehicle fuel efficiency.
Road transport contributed 16% to total CO2 emissions in 2000 and this grew to 18% in 2010 and 21% in 2016.
We are the only OECD country with no minimum fuel standard while more than 80% of the global vehicle market has adopted fuel standards. We have had standards for many years relating to other vehicle emissions such as nitrous oxides, carbon monoxide and particulates.
Standards in other countries
The EU applied mandatory standards from 2009 requiring a light vehicle fleet average of 130 g CO2/km by 2015 and 95 g/km by 2020–21.
These standards have been further developed requiring a reduction by 15% by 2025 and 37.5% by 2030 relative to 2020–21. Standards will also be applied to heavy vehicles.
The USA has had voluntary standards since 1975 that have not been effective. In 2012 standards were introduced including a reduction by 3% each year after 2012 applied to each manufacturer. They are enforced with the potential of the loss of licence to sell vehicles. The effective standard is slightly higher than applies to the EU. However President Trump is now threatening to loosen the standards.
Testing methods are problematic
The sources used for this article comment on ongoing issues with the testing methods being used to monitor vehicle fuel use.
The standard methods used in Europe were developed in the 1970s. They are called the New European Drive Cycle (NEDC) and they have been found to be unrealistic because they assume that the car is being driven at a constant speed with mild acceleration. Actual consumption that has been tested in real conditions show the gap is getting worse and is now believed to be about 40%.
The sources don’t explain why the gap is getting worse apart from the legal methods of manipulating the tests, e.g. by using low-resistance tyres. The latest EU standards will require cars to have on-board monitoring systems in future.
Clearly there is a need for proper testing of on-road vehicle emissions. One wonders about the accuracy of the greenhouse gas reporting for Australia’s transport emissions. The same applies to reporting by other countries.
The standards are applied on a fleet wide basis but then manufacturers have to apply the standard to their individual range of vehicles. The projection of future emission levels requires an estimate of the nature of the vehicle fleet that is a combination of several cohorts of ages of vehicles plus the average distances travelled by each type of vehicle.
Australia’s experience
The current situation is that in 2017 Australia’s light passenger average CO2 emissions were 172 g/km compared with 118.5 g/km in the EU. In the case of light commercial vehicles Australia’s average was 222 g/km compared with 164 g/km in the EU.
In addition to the lack of efficiency standards, according to a report from Transport Energy/ Emissions Research [1] several other factors contribute to Australia’s higher vehicle emissions:
- Use of heavier and greater engine capacity cars such as SUVs (even in comparison with the USA). It is reported that in 2017 the average fuel use in Australia was 20% higher than in the USA. This trend is getting worse.
- Use of automatic transmissions that are reported to be less fuel efficient.
- Greater distances travelled. The Australian Bureau of Statistics reported that total travel by passenger vehicles in Australia was 142 billion kilometres in 2000. This has been growing to 176 billion kilometres in 2016, an increase of 24%.
- The most fuel efficient model choices in Australia are not as efficient as in Europe leading to the suggestion that manufacturers are taking advantage of our lack of mandatory standards.
- Our vehicle fleet is older than in other countries and turnover is slower so it takes longer for the benefit of newer, more fuel-efficient vehicles to flow through to the fleet as a whole. Conversely driving a vehicle for a longer period could produce lower emissions when allowance is also made for the emissions during manufacture.
It is also suggested that Australians are paying paying about 30% more for fuel than they should (provided better fuel efficiency doesn’t encourage more driving).
Australia’s attempts to introduce standards
Australia has had voluntary efficiency standards since 1978 that were equivalent to 195 g CO2/km (2000) and 161 g CO2/km (2010) but these have not been achieved.
In 2010, the ALP government decided that mandatory CO2 emissions standards would apply to new light vehicles from 2015, i.e. a national fleet wide average of 190 g/km in 2015 and 155 g/km in 2024. However, the change in government in 2013 meant the standards would not see the light of day.
Several reports have been written analysing the options for introducing standards.
The Climate Change Authority produced a report in December 2016 that proposed that the first phase of mandatory standards be introduced with effect from 2018, by which time local manufacture of automobiles was expected to have ceased.
The standards would progressively reduce CO2 emissions from new light vehicles to 105 g/km in 2025, almost half the then current level of 192 g/km. This 2025 standard would broadly bring Australia into line with the USA and still trail the tighter EU targets by several years.
A Ministerial Regulation Impact Statement found that the introduction of a standard of 105 g/km phased in over 2020–25 would cost $16.2 billion compared with no standards but would lead to:
- national fuel savings of $27.5 billion
- reduce greenhouse gas emission by 65 Mt by 2030
- create an overall net benefit to the economy of $13.9 billion
This calculation allowed for a cost of carbon emissions of about $50/tonne.
The Automotive Association has lobbied against the proposal on the grounds that cars will be more expensive. Implementation of a standard to reduce CO2 emissions to 105 g/km is estimated to increase the average cost of a new car in 2025 by about $1500. This, however, would be offset several times by fuel savings of about $8500 over the life of the vehicle, leaving motorists better off.
How about electric vehicles?
The rollout of electric vehicles in Australia is being held back by their cost and lack of recharging stations. Labor’s election proposal to require that 50% of new passenger vehicles sold be electric vehicles by 2030 was hysterically dismissed by Scott Morrison. He claimed the policy would make life impossible for tradies as the ute would be uneconomic and it would spell the end of the weekend trip away in the SUV.
Of course this was all nonsense as the cost of electric vehicles is coming down rapidly and is expected to be similar to internal combustion engines by 2025. We might even revive the local manufacturing industry? In any case perhaps it would be a good idea to hire a large SUV for a weekend trip rather than driving these large vehicles around to drop the kids off at school or commute to work.
One question about the use of electric vehicles is the carbon emissions if they are being recharged using electricity from the current high use of coal-fired generation. The data I have found indicates that electricity consumption to run an electric vehicle could be 6–10 Kw h per 100 km. Currently Australia’s emissions from electricity generation is 800 g/Kw h. So that equates to carbon emissions from electric vehicles of 48–80 g/km.
Conclusion
The available evidence suggests that legislative action regarding vehicle CO2 emissions is long overdue. The federal government must take action to ensure total CO2 emissions from road transport are reduced by introducing emission standards and by taking several additional measures such as increasing public transport and reducing distances driven.
Introducing these new regulations quickly is a priority because it takes years for them to actually work their way through the market to the new vehicle fleet.
References
[1] Transport Energy/Emission Research Pty Ltd Vehicle CO2 Emissions Legislation in Australia – A Brief History in an International Context
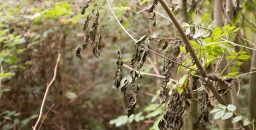
Threat to a Common European Tree

The costly problem of ash dieback has been highlighted in New Scientist.
This fungal disease caused by Hymenoscyphus fraxineus was first detected in Britain in 2012 having crept across Europe from the east. Its origin is Asia and it affects the common ash Fraxinus excelsior. It's predicted to destroy more than 90% of the many million ash trees, killing saplings within a year of infection. Coming on top of Dutch elm disease and various infections of both English oak species, it's a concern in a country that has, through millennia, lost most of its native forests.
They are all Fiddling while the World Burns
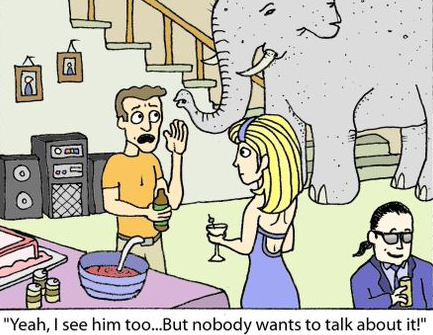 When the USA became serious about WWII they brought about an amazing mobilisation of their entrepreneurial industrial potential. That is surely the way in which the fight against global warming will be conducted when we eventually wake up to the urgency. In the meantime most of the world’s leaders and most of the populace seems content enough to drift along ignoring that elephant in the room.
Part of that mobilisation will surely be the recognition that population growth is a major cause of ongoing warming. Halve the population and we roughly halve much of the pollution causing warming as well as other pollution such as plastics.
That brings us to what’s happening in Australia.
With an average of about 12.5 million people over the past 220 years we have degraded our major river systems, caused a terrible list of plant and animal extinctions, degraded our topsoils and more and are now busily overpopulating our major cities - with consequent physical and social consequences.
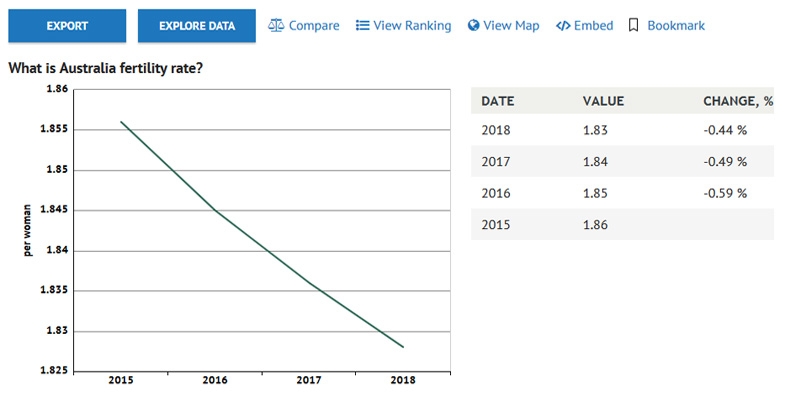
Our current annual rate of population growth of 1.7% will lead to doubling every 42.5 years. That means 50 million in 2061, 100 million in 2104 and 200 million in 2146 and so on.
You would think that those numbers would be enough to promote some discussion of where we are heading and where we want to head and how to go about it. But no, the Coalition, Labor and the Greens, along with our major environmental groups such as the ACF and NCC, all seem intent on ignoring the elephant and ensuring further degradation and destruction of the Australian natural world.
Why is this thus? We think there are a few reasons.
Firstly there is huge ignorance around the maths of exponential growth. It’s amazing to find so many educated, even scientifically educated, people who have not a clue about the consequences of 1.7% growth.
Secondly, the mainstream media and political world has insisted in conflating population growth with protecting the borders and racism. You talk about less population and so many assume that you are dog-whistling and really mean that we don’t want those refugees. The ABC has a terrible record in this regard.
Thirdly, the big end of town, those whose lobbyists haunt the corridors of our parliaments, cheque books in hand, has convinced many that without economic growth we shall all become destitute. That is simply self-serving rubbish that suits their economic interests. More people mean more housing, more furnishings, and more of most things. It’s not the environment they worry about – it’s their never-ending need for more economic activity and more profit.
Australia’s fertility is now about 1.83 which will eventually produce a declining population because it is below the replacement level of 2.1. In addition, some 50,000 people leave Australia permanently every year. This means that we can accept 70,000 immigrants per year and eventually stabilise our population. We should do so. There is plenty of room there for refugees.
STEP has never dog-whistled!
It’s hard, however, to know how we shall ever start to manage the situation so long as none of the elites are prepared to discuss it and so long as the environmental organisations don’t have the guts to confront it.
We have been writing about population for over thirty years and much more detail can be gleaned from our Position Paper on Population.
By John Burke, former president of STEP and chief author of STEP’s Position Paper on Population, has written this update on the population issue.
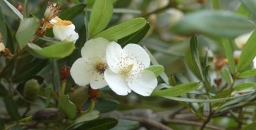
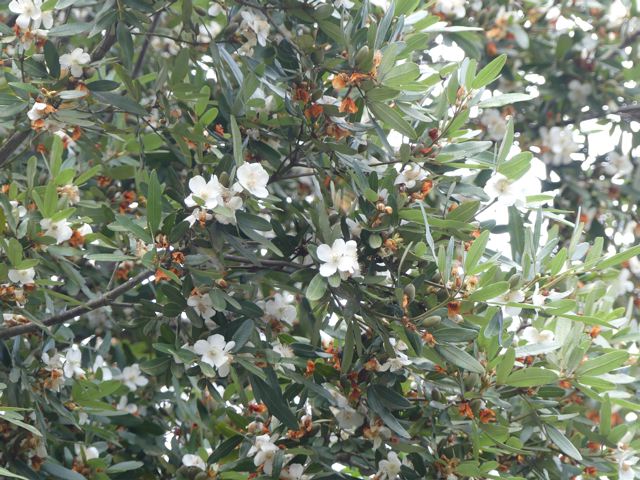
The Future of Tasmanian Leatherwood

Visiting Tasmania at leatherwood flowering time in February was a nice experience apart from the weather. It has a perfumed flower likened to a four-petalled version of the five-petalled English wild dogrose. Tasmanian Leatherwood Eucryphia lucida, of honey fame, is a high rainfall, temperate rainforest species often found close to rivers (see the two pictures below taken at Pencil Pine Creek, Cradle Mountain). Driving along the Lyell Highway from Queenstown to Derwent Bridge we saw several beehive ‘mini cities’ in valleys, clearly exploiting the setting of the plant.
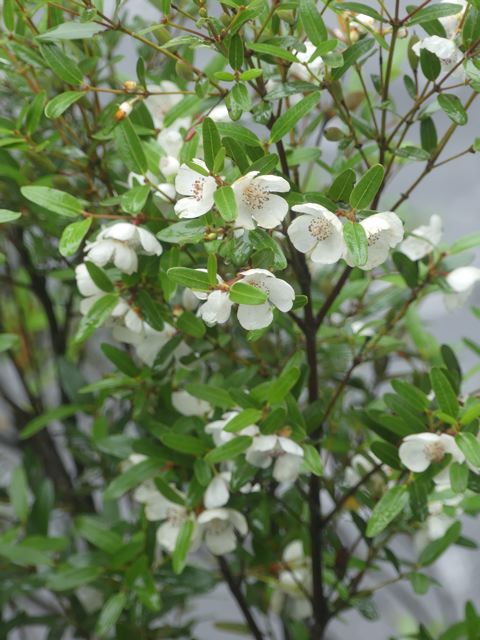
Australia has five species of Eucryphia, one of the commoner ones, E. moorei (see the picture at the top of the page and below) liking wet highland environments from the Illawarra to north-east Victoria.
The easiest place to see it locally in late summer is across the road from the Robertson Pie Shop where a windbreak hedge of small trees to 5 metres follows a fence line. We also saw it in flower at Fitzroy Falls, several specimens being scattered through the rainforest apron of the valley, though you wouldn't spot them without their flowers.
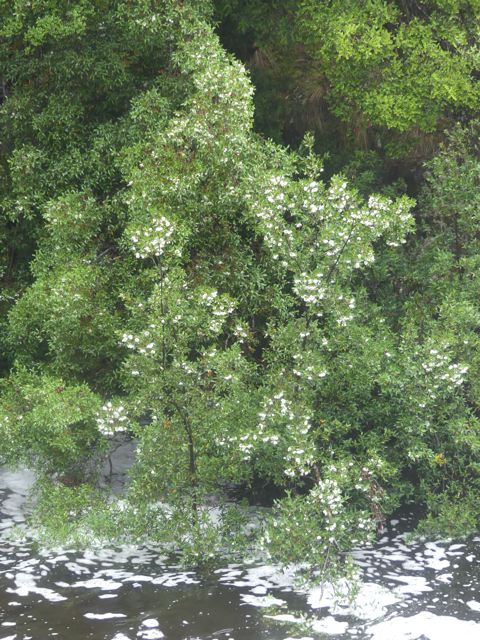
 The latter setting is more typical for the tree and it seems to also like rocky sites – we located another tiny colony in Hawkesbury Sandstone on rocky Bundanoon Creek in Meryla State Forest south of Moss Vale.
All Australian species grow in high rainfall, cool to warm temperate settings ranging from E. moorei of the Illawarra to E. wilkiei of the mountain cloud forests of North Queensland. But globally the picture of Eucryphia is bigger.
There are a further two species, E. cordifolia and E. glutinosa, from cool temperate rainforests of South America. And it turns out that there are striking similarities in the flavour of honeys from the Chilean E. glutinosa, known there as Ulmo, and that of Tasmanian Leatherwood. This is particularly extraordinary since the two continents severed their link via Antarctica more than 60 million years ago.
Eucryphia species have been cultivated in Australia, Europe and elsewhere, and include pink-flowered forms and hybrids. While the variety of rugged and inaccessible settings of common species like E. moorei may mean they are fairly safe, the northern species, E. jinksii and E. wilkiei are both local and endemic to their settings and are listed as threatened. E. wilkiei of Mt Bartle Frere cloud forests is especially vulnerable to climate change – horrendous heat records were set there this summer.
Of further concern, Tasmania was beset by wildfires this summer, particularly in the Huon Valley region south-west of Hobart. This, and the drought that amplified it, had a variety of negative effects on Leatherwood. There were multiple tree losses and flowering was weak: trees that did flower produced very little nectar. The suspected link to climate change is a cause for concern and Leatherwood may yet be another canary in the coal mine. Anyway, if you're looking to buy Leatherwood honey this year it won't easy or cheap.
References
Wikipedia
Blog: The Nature of Robertson
By John Martyn
How did the IPBES Assessment come up with the Figure of a Million Species at Risk of Extinction?
In May 2019 the Intergovernmental Science-Policy Platform on Biodiversity and Ecosystem Services (IPBES) published its global assessment of the state of the earth’s biodiversity and its prospects for change up to 2050. This is the first such report since the landmark Millennium Ecosystem Assessment published in 2005. The IPBES Assessment is the outcome of negotiations by 134 governments using data provided by 500 biodiversity experts from over 50 countries.
The aim of the IPBES Assessment is explained by its chair, Sir Robert Watson:
The loss of species, ecosystems and genetic diversity is already a global and generational threat to human well-being. Protecting the invaluable contributions of nature to people will be the defining challenge of decades to come. Policies, efforts and actions – at every level – will only succeed, however, when based on the best knowledge and evidence. This is what the IPBES Global Assessment provides.
It examines causes of biodiversity and ecosystem change, the implications for people, policy options and likely future pathways over the next three decades if current trends continue, and other scenarios.
My question is how did IPBES work out the number of species existing and at risk of extinction?
How many species are there?
Several different approaches have been used to estimate the actual total number of species on earth. Frankly it is impossible to know the number with any reasonable level of precision. The various methods give a very wide range of answers – from 3 million to over 100 million. Most of the more recent estimates based on thoughtful approaches are in range of 5 to 20 million.
The main point is to understand the relative level of extinction that could take place. We are finding new species all the time. There are frequent reports of excursions into rainforest finding lots of new beetles or other insect species. New species are even being found in our local area, viz Julian’s Hibbertia.
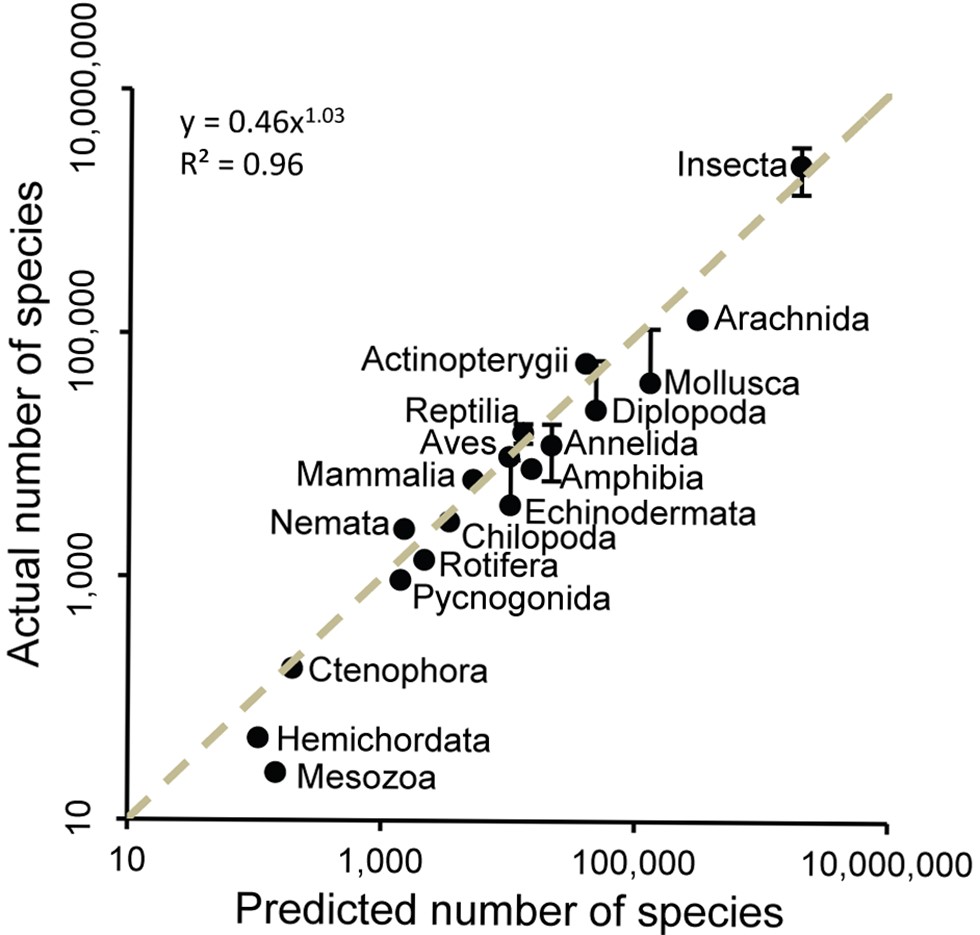
The report uses the results of a study published in 2011 [1]. The study uses data of past records showing how the knowledge of the number of phyla, classes, families, genii and species for each taxa have increased over time. For each level of the description hierarchy (phyla, class, etc) if fewer and fewer new types are being found then it is assumed that we are getting close to finding the final actual number. The method fits a regression line to the asymptotic graph of the known number over time to estimate the point where the line would reach the limit of increases. Then the phyla build into the number of classes and so on.
 One argument in favour of this method is that species that are yet to be identified are living in small numbers or in niche areas so they are of less significance in terms of total life on the planet.
This approach was validated against well-known taxa such as mammals. When applied to all eukaryote kingdoms the approach predicted:
- ∼7.77 million species of animals
- ∼298,000 species of plants
- ∼611,000 species of fungi
- ∼36,400 species of protozoa
- ∼27,500 species of chromists
In total the approach predicted that ∼8.74 million species of eukaryotes exist on earth. Restricting this approach to marine taxa resulted in a prediction of 2.21 million eukaryote species in the world's oceans.
In spite of 250 years of taxonomic classification and over 1.2 million species already catalogued in a central database, the study’s results suggest that some 86% of existing species on earth and 91% of species in the ocean still await description.
How did IPBES derive the million at risk figure?
Species are defined as being at risk of extinction if their numbers are declining to the extent that the population may no longer be viable. They may not become totally extinct for a long time. For example, plants may live for many years but may not be reproducing.
The International Union for Conservation of Nature (IUCN) Red List of Threatened Species’ definitions of vulnerable, endangered and critically endangered are used to encompass the overall concept of being at risk of extinction.
The IUCN Red List is the world's most comprehensive inventory of the global conservation status of plant and animal species. It uses a set of quantitative criteria to evaluate the extinction risk of thousands of species. These criteria are relevant to most species and all regions of the world. With its strong scientific base, the IUCN Red List is recognised as the most authoritative guide to the status of biological diversity.
Currently the IUCN Red List status is that 36% of the 47,677 species assessed are threatened with extinction, which represents:
- 21% of mammals
- 30% of amphibians
- 12% of birds
- 28% of reptiles
- 37% of freshwater fishes
- 70% of plants
- 35% of invertebrates
that have been assessed.
Averaged across all the taxonomic groups of animals and plants that have had IUCN Red List assessments, about 25% of species are threatened. But the sparse data for insects so far suggest it might be lower – estimates range from 10 to 15% – so IPBES used a figure of 10% that might turn out to be conservative. If insects are three-quarters of animal and plant species, there are 5.5 million of them, of which 10% are threatened (so, more than half a million insect species are threatened). If 25% of the other 2.6 million species are threatened, that’s more than half a million non-insect species threatened. Hence the rounded total figure is about 1 million species at risk of extinction.
Are the headlines about loss of species meaningful?
Some very broad assumptions have been used in coming up with the figure of 1 million species at risk of extinction over the next few decades. One wonders if this is a meaningful exercise.
Are people going to take more notice of this announcement?
Is there a better way of illustrating the significance of the threat of massive biodiversity loss over the next few decades?
Maybe the percentages quoted earlier mean more, such as 70% of plants and 21% of mammals?
Another factor that may be more significant is the loss of biomass of plants and animals. Recent studies have pointed to the significant decline in biomass of insects. Dr Sanchez-Bayo from Sydney University pointed this out in a recent paper to the journal Biological Conservation [2].
Besides all the important functions that insects play in our ecosystems - such as pollination, or recycling nutrients - they are also an essential element in the food chain that supports life on our planet. When the insects go, the frogs, birds and mammals don't have food.
The IPBES Assessment is mostly devoted to describing the reasons for species decline and what should be done about it. The reasons are not hard to find: exploitation, land clearing, weed and pathogen invasion, climate change.
Currently biodiversity law and policy is inadequate to redress the situation. If we are to halt the continued loss of nature, then the world’s legal, institutional and economic systems must be reformed entirely. And this change needs to happen immediately.
Reference
[1] Mora, C; Tittensor, DP; Adl, S; Simpson, AGB; Worm, B (2011) How Many Species are there on Earth and in the Ocean? PLOS Biol 9(8): e1001127
[2] Sánchez-Bayo, F and Wyckhuys, KAG (2019) Worldwide Decline of the Entomofauna: A Review of its Drivers. Biological Conservation 232, 8–27
Great Season for Fungi
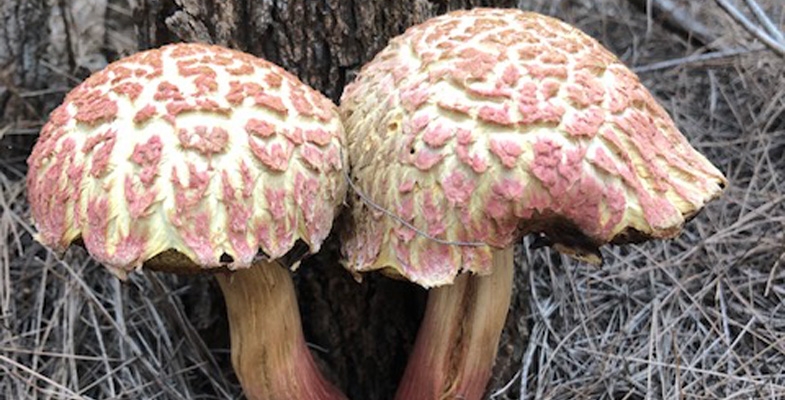
Our walk in Fox Valley on 14 April revealed some surprises. A Powerful Owl was spotted and there were several unusual examples of fungi as identified by John Martyn.
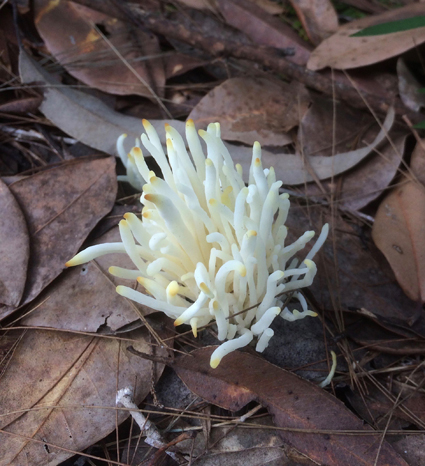
Calocera or Dead Man’s fingers
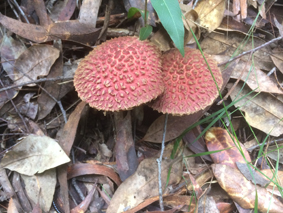
Bolettus emodensis
New Committee Member

We welcome Peter Clarke as a new member of the committee. He is well known for his work with Ku-ring-gai Council developing new programs such as the native bee hive rollout (how about coming to the talk he's giving about native bees) and pool to pond. He is a familiar face on the educational videos on EnviroTube.
Peter’s great knowledge of the Ku-ring-gai bushland and his education skills will be a great asset to STEP.