STEP Matters 189
- Default
- Title
- Date
- Random
- It's important that as many people as possible comment on the Greater Sydney Strategy and the North District Plan by…Read More
- Have your say on the North District Plan and the Greater Sydney Strategy by 31 March 2017. District Plans cover…Read More
- Ku-ring-gai Council has been developing plans to improve the Turramurra local centre over many years. As a resident of Turramurra…Read More
- STEP is delighted that our secretary has received Ku-ring-gai Council’s Australia Day Award for Outstanding Service to the Ku-ring-gai Community…Read More
- The geology of the Sydney Basin changes dramatically at the top of the Hawkesbury Sandstone, which is followed upwards ultimately…Read More
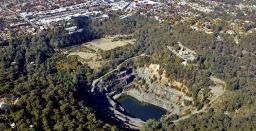
- Hornsby Council has moved to the next stage of planning for the redevelopment of Old Mans Valley and the Quarry.…Read More
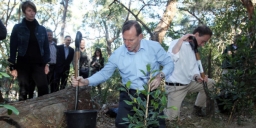
- It’s a rare week when natural resource management policy penetrates the national news cycle not once, but twice. Nonetheless, last…Read More
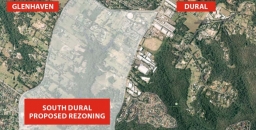
- We've previously summarised our concerns about the application to rezone rural land to residential land. It is a relief that…Read More
- The Institute for Economics and Peace has supplemented their Global Peace Index with a Positive Peace Report 2016. But be…Read More
Why Give the Green Army its Marching Orders?
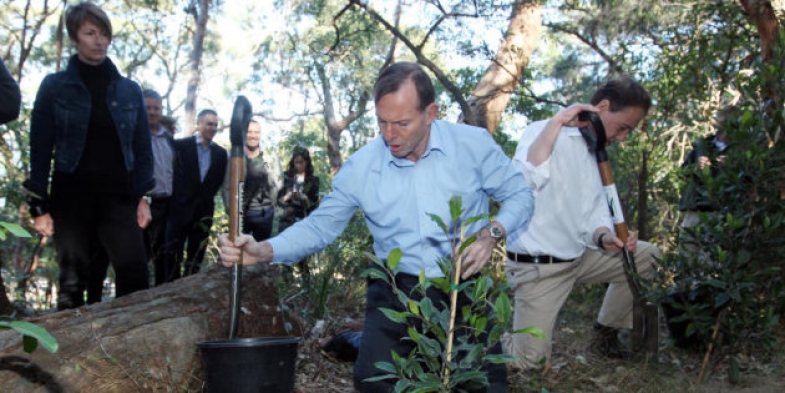
It’s a rare week when natural resource management policy penetrates the national news cycle not once, but twice.
Nonetheless, last Thursday the federal government struck a deal with the Greens to increase funding to Landcare programs by $100 million in exchange for their support on other matters. No one quite seems to know yet how this money will be spent – presumably in ways that support the thousands of volunteer community Landcare groups dotted around Australia.
Then on Sunday, the Australian Financial Review reported that the government will abolish the Green Army program as part of its mid-year budget update later this month.
Introduced in 2014 as a signature policy under the then prime minister, Tony Abbott, the Green Army aimed to mobilise 15,000 young and unemployed people to work on conservation projects and receive complementary training. Axing the program would deliver budget savings of around $350 million.
Abbott took to Facebook on Monday to criticise the move. His main concern seems to be the implication that the Greens’ policy priorities are more important than the Coalition’s. That’s a bad look, he argues, for a 'centre-right government'.
Yet the move would arguably be very much in keeping with centre-right values. By reinvigorating Landcare’s model of personal responsibility and self-regulation, the government could reduce pressure to regulate land use or to pay landholders financial incentives to improve their environmental management.
But consistency with any particular political philosophy is not the issue here. The hyper-polarised political landscape of recent years, particularly on environmental policies, encourages parties to differentiate on any grounds they can. Thus, the cross-party support long enjoyed by Landcare can perversely work against it. Incoming governments believe they need new programs to claim as their own, diverting attention and resources from those already in place.
The $484 million cut to Landcare in the 2014 budget needs to be remembered in this context. Both Coalition and Labor governments have made changes over the years that either reduced the financial support available to community Landcare groups, or imposed more top-down modes of decision-making.
The 2015 Senate inquiry into the National Landcare Program revealed considerable community concern about the impacts of budget cuts on Landcare’s activities and on private commitment to natural resource management. Every dollar of public money invested in Landcare is believed to leverage between $2.60 and $12.00 of community and landholder investment.
When the Green Army was launched, many people questioned whether it would deliver this kind of value for money. With a three-year review of the Green Army due for release early next year (subject to ministerial approval), we might have expected to see some answers.
So why is the Green Army is being cut before the review? Perhaps the government is sparing itself the embarrassment of defending a program that is failing to meet its objectives. Perhaps, despite the critics, the findings would have been positive and the government is avoiding having to explain why the Green Army is being killed off anyway. Perhaps it’s just looking for easy budget savings.
Strategic plan?
Whatever the motivation, the biggest concern is the absence of a strategic and coherent approach to natural resource management policy in Australia. Major program changes are being made with limited consultation and transparency, and precious little evidence of planning.
At the same time, some policies and programs appear to be working at cross purposes. For example, tree clearing is increasing in much of Australia at the same time that some landholders are being paid through the Emissions Reduction Fund to conserve native vegetation.
Questions need to be asked about the genuine impacts of existing policy, about the way in which regulations intersect with voluntary programs, and about coordination between Commonwealth and state governments, among other issues.
The recent Senate inquiry into Landcare called for long-term investment and stability in natural resource management programs. Achieving this will require a return to genuine cross-party support coupled with broader community and industry support. The key to achieving this, I suspect, is less wheeling and dealing among political parties and more consultation and planning with all interested stakeholders.
It might be time to consider a white paper process to inform the next phase of natural resource management policy. At least that would give us some confidence policy is not being decided on the run.
Stewart Lockie, Director, The Cairns Institute, James Cook University
This article was originally published on The Conversation. Read the original article.
Australia Day Award for Helen Wortham
STEP is delighted that our secretary has received Ku-ring-gai Council’s Australia Day Award for Outstanding Service to the Ku-ring-gai Community (Individual).
Helen has been the key engine-room of STEP as a committee member since 1990 and secretary since 1997. She has devoted many hours applying her comprehensive skills to the operation of STEP. Her work has included maintaining the membership records, creating communication material, editing our newsletter and publications, promoting and selling our books and maps. More recently she has been the brains behind the modernisation of our website and the transformation of our newsletter distribution into the digital age.
Without Helen’s selfless devotion STEP could not have functioned successfully.
Sandstone-Shale Transition – the Mittagong Formation
The geology of the Sydney Basin changes dramatically at the top of the Hawkesbury Sandstone, which is followed upwards ultimately by the thick, shale-dominated Wianamatta Group. It isn’t an abrupt change but usually a transition, via several metres of alternating sandstones and shales called the Mittagong Formation. The quartz-rich sandstones of the Mittagong resemble finer-grained versions of the Hawkesbury Sandstone and they are interleaved with dark grey to black shales, siltstones and laminites.
Originally named Passage Beds by JF Lovering in 1954, the current name was adopted from a selected type locality, the Gib (Mt Gibraltar) railway tunnel at Mittagong, where the formation is 15 m thick. Elsewhere it is almost invariably less than 10 m and can locally be absent altogether. Exploratory drilling for the Epping to Chatswood railway tunnel at Macquarie Park, for example, encountered only a 2 to 5 m thickness of it.
The variability is in part due to the nature of the dwindling flood plain and braided river system which deposited the Hawkesbury Sandstone. This vast system eventually lost its strength and became a plain of scattered sandbanks, swamps and lagoons. Clays settled in the latter but were periodically overwhelmed by sand brought by late floods leading to a sandstone/shale alternation of very variable thickness.
For such a thin unit the Mittagong Formation has a disproportionate effect on vegetation because it usually creates a broad bench at the top of the Hawkesbury Sandstone’s steep rocky dropoffs and cliff lines. This leads to the retention of soils and can even collect downwash from overlying Ashfield Shale if present. Such level surfaces can also attract deep weathering and laterite formation.
Like the shale lenses in the Hawkesbury, Mittagong Formation forms richer soils than the sandstone but stonier, more lateritic and less fertile than those of the overlying Ashfield Shale. These yellowish soils are typically classified as belonging to the Lucas Heights soil landscape, highlighting similarities in the bedrock between Mittagong Formation and Hawkesbury Sandstone with its shale lenses in the Lucas Heights area.
Plant communities hosted by Mittagong Formation are diverse and usually gradational to those of adjoining shale or sandstone, often falling within the broad envelope of Shale Sandstone Transition Forest with either a sandstone bias or a shale leaning depending on setting. In other sites the communities may be more tightly defined in terms such as Sydney Turpentine Ironbark Forest, Turpentine Ironbark Forest, or where strongly lateritised, Duffys Forest. They tend to have one thing in common, they are mostly legally defined as threatened, mainly because they survive in narrow, disjointed enclaves isolated by land clearing.
Is it Possible to View the Mittagong Formation?
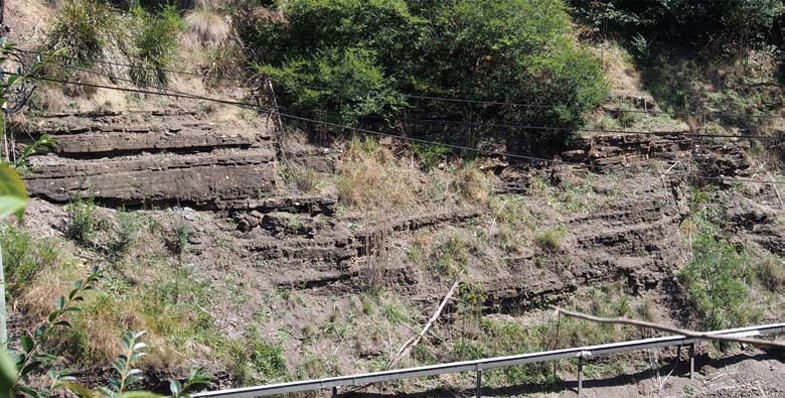
Not as easily as you might think, and only in artificial cuttings – natural exposures are virtually unknown!
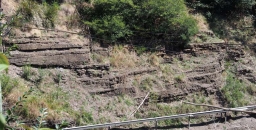
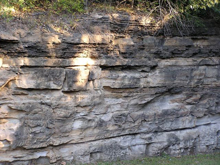 You can look at its type locality at the south-west end of the Gib Tunnel at Mittagong but only by telephoto lens through a security fence (see photo at the top of this page). It's also visible in cuttings along the M31 nearby, but at 110 km/h it's a case of ‘don't blink or you'll miss it’. The best locality is probably the road cutting of the Picton railway overbridge (see photo) though you'll have to park down the road and walk back in if you want to see it hands on.
In our own local area there are a number of rather poor and vulnerable artificial exposures, like the M2 cutting under the Barclay Road over-bridge at North Rocks. But this is currently being plastered in concrete by the North Connex guys and will soon largely disappear. The embankment of the Abbott Road eastbound feed-in lane to the M2 is good too but you can't stop there, nor can you for the south-west embankment of the M2 north-west of the Lane Cove Road interchange at Macquarie Park.
As for natural outcrops, when you stroll around in bushland on the flat ground above Hawkesbury Sandstone dropoffs you may see abundant shards of lateritised shale and siltstone in the soil, but unless you stumble on an erosion gully or creek line you'll be lucky to see anything more.
Sheldon Forest
Sheldon Forest is a pretty good start. Wander down past the scout hall to the sweeping apron of tall Blackbutt forest and you'll be descending from Ashfield Shale onto Mittagong Formation. As the track descends further towards the Hawkesbury Sandstone dropoff there is a marked increase in Turpentines, Sydney Red Gums and many shrubs of sandstone affinity such as banksias. But you don't have to return very far back uphill before shale species like the pea-flowered groundcover Tick Trefoils Desmodium rhytidophyllum and D. varians reappear.
Auluba Reserve
At roughly 3.5 ha, this is probably the largest area of Mittagong Formation bushland in the Lane Cove catchment. It's primarily Blackbutt forest very like lower Sheldon but several other tree species are present, notably Sydney Red Gum, Red Bloodwood and Red Mahogany, and both White and Narrow-leaved Stringybarks are present though these are rare, scattered and sometimes in poor condition. The shrub flora is rich and includes the critically endangered Julian's Hibbertia, H. spanantha. The Sydney region has a greater diversity of hibbertias than any other similar-sized region of Australia and H. spanantha will very likely not be the last new species to be discovered.
North Epping Oval Bushland
This sits above the sandstone on the opposite side of the Lane Cove Valley across from South Turramurra. It's a small area with a very diverse tree community, including Sydney Red Gum, Red Bloodwood, Narrow-leaved Stringybark, Sydney Peppermint, Blackbutt, Turpentine and Christmas Bush. The shrub Laurel Geebung Persoonia laurina, uncommon in the Lane Cove catchment, is quite common here.
Fred Cateson Reserve, Castle Hill
Located at the junction of Showground Road and Gilbert Road, this is a classic locality to walk from shale cap down across the Mittagong Formation and see key plant species. The lower parts of the reserve are Hawkesbury Sandstone but the crest of the rise bordering Gilbert Road carries shale and transitional flora, notably with trees like Grey Gum, White and Thin-leaved Stringybarks, Grey, Broad-leaved and Narrow-leaved Ironbarks, Red Mahoganies and Forest Red Gums. As you descend towards the sandstone, Red Bloodwoods and Black She-oaks assert their presence.
Fagan Park – Carrs Bush, Galston
A stones throw north of Galston, this popular area of grassy park, lakes and bushland straddles the sandstone–shale transition zone, though how much is Mittagong Formation and how much Ashfield Shale is hard to deduce on the ground. The bushland fringe along Arcadia Road is certainly on shale and you can find good specimens of White Stringybark, White Mahogany and Grey Ironbark. This changes north-eastwards, and if you enter the park from Carrs Road you will first see the odd White Mahogany and Grey ironbark but you will immediately enter an area of pure Turpentine forest, almost certainly hosted by Mittagong Formation soils.
This is the third in a series of articles by John Martyn on Sydney’s geology.
Have Your Say on Hornsby Quarry Development
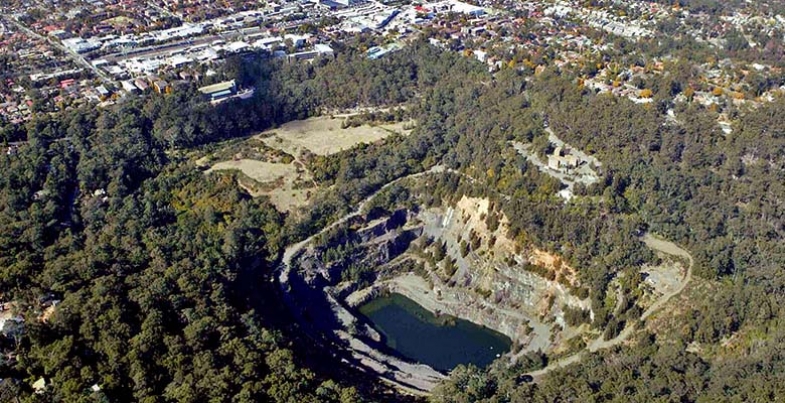
Hornsby Council has moved to the next stage of planning for the redevelopment of Old Mans Valley and the Quarry. There is an opportunity for you to make suggestions about how the area should be developed and used.
South Dural Development Stopped … For Now
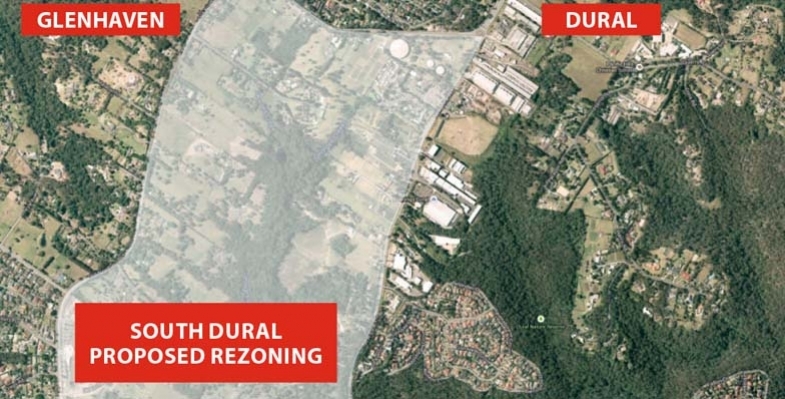
We've previously summarised our concerns about the application to rezone rural land to residential land. It is a relief that Hornsby Council has decided to discontinue evaluation of the proposal. But this is only until an infrastructure and funding plan is in place for this and other developments in this rural area.
Over 5,000 submissions were made opposing the development, many for reasons other than congestion along New Line Road and lack of other infrastructure. There will be more opposition to come when the developer has another go. With any luck the proposal will be deemed inconsistent with the North District Plan that aims to retain rural land.
Greater Sydney Strategy
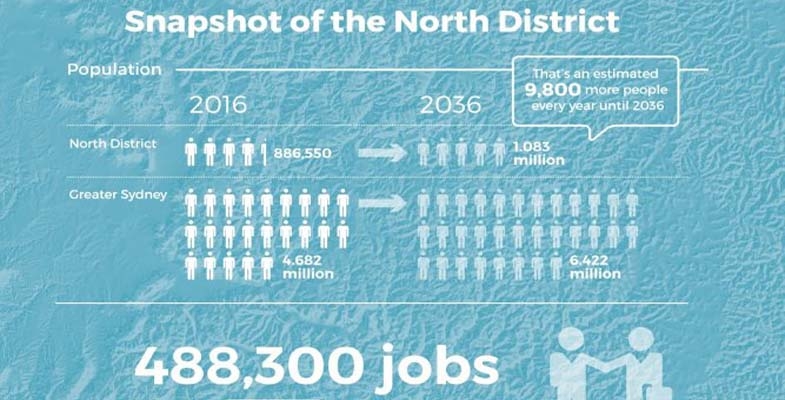
It's important that as many people as possible comment on the Greater Sydney Strategy and the North District Plan by 31 March 2017.
Towards Our Greater Sydney 2056 is a 40 year vision that spells out the anticipated rate of growth and framework for employment and population distribution. How this is done will ultimately determine the long-term impacts on our natural areas, STEP’s chief focus.
For a city the size of Sydney, strategic planning over a 40 year period is important. However as outlined below there are matters of serious concern.
High Rate of Growth
On p8 there is this statement:
Greater Sydney is experiencing a step change in its growth with natural increases (that is an increase in the number of births) a major contributor. We need to recognise that the current and significant levels of growth, and the forecast higher rates of growth are the new norm rather than a one-off peak or boom.
Given the clear impacts of high growth rates on our urban amenity this statement needs closer scrutiny.
Refer to the table below for the projected growth rates and the figure below for the net overseas migration component.
| Region | Population 2011 | Projected population | ||
| 2036 | Change 2011–36 | % change 2011–36 | ||
| Greater Sydney | 4,286,350 | 6,421,950 | 2,135,650 | 49.8% |
| Rest of NSW | 2,932,200 | 3,503,600 | 571,400 | 19.5% |

From the figures the total projected increase in population in NSW from 2011–36 is around 2.7 million. Of this, for the same period, the total from net overseas migration is around 1.7 million, leaving the natural growth at around 1 million.
A recent report by the Planning Institute of Australia on population trends, Through the Lens: Megatrends Shaping our Future (p12) concluded:
Overseas migration continues to be the biggest contributor to population growth.
Net overseas migration for Australia since 1976 is shown in the lower figure. On p12 it says that:
Of the three basic factors determining population growth (fertility/births, mortality/deaths and migration) the net migration rate is most subject to policy intervention, and thus the most uncertain in future projections.
 Since the net migration rate is the primary determinant of Australia’s population growth and is controlled by government policy, it is clearly possible to regulate the overall population growth rates of Australia to ensure they are at acceptable levels and anticipated benefits are broadly realised.
The regulation of inflation by the Reserve Bank has proved beneficial relative to an unregulated economy. Regulation of Australia’s overall population level and age structure through adjustment of net migration targets by a Federal government agency could prove beneficial to planning within Australia. This agency has to work in concert with state governments that bear the brunt of the implementation consequences.
High growth rates are resource intensive, difficult to manage and can lead to significant long-term environmental impacts. In the past these have included a higher proportion of defective buildings, lags in required new infrastructure with traffic congestion increasing and damage to bushland and watercourses from greater urban stormwater run-off.
The current proposed annual growth rates of around 1.6% are too high and need to be reduced to the more manageable levels in the previous three decades of around 1%. The Mercer World’s Most Liveable Cities ranking indicates that beyond a population of around 6 million liveability declines. Sydney has to recognise that growth cannot be infinite and ultimately must plan for a zero net growth future.
The Greater Sydney Commission may not have a say in the growth projections but we think people should be able to express their views through the current consultations process and local federal and state MPs.
Urban Renewal
On p8 it states that the shorter term need for additional new housing capacity is greatest in the North and Central Districts. While this will lead to more high-rise development along the railway line it is important that urban conservation corridors are retained.
For example it is possible to walk from Gordon, Killara and Roseville Stations through high quality urban conservation areas to the bushland that leads to Garigal National Park. The value of these conservation corridor links from railway stations to our national parks can only increase with time.
Medium Density Infill Development
On p9 it states:
Many parts of suburban Greater Sydney that are not within walking distance of regional transport (rail, light rail and regional bus routes) contain older housing stock. These areas present local opportunities to renew older housing with medium density housing. Medium density housing is ideally located in transition areas between urban renewal precincts and existing suburbs, particularly around local centres and within the 1 to 5 km catchment of regional transport.
A 1 to 5 km catchment from the railway stations and regional bus routes would include virtually all of the North Shore. Future medium density in these areas is likely to be fast-tracked by developers using the NSW government’s proposed Complying Medium Density Housing Code (CMDHC).
Provided prescribed standards are met this could allow building density increases by as much as a factor of two without the need for consent. Because of its indiscriminate nature, for those areas impacted by the code, it could lead to increases in dwelling numbers significantly in excess of those planned for.
The CMDHC is proposed in extensive single dwelling R2 zones for those councils where multi-dwelling housing or dual occupancy is permissible in this zone. If one council allows multiple dwellings it will flow through to all the original member councils when they amalgamate.
Examination of the relevant LEPs indicates all the amalgamated councils in the North District will be impacted with the exception of Hornsby–Ku-ring-gai. STEP strongly opposes application of CDMH in any residential zone other than the medium density R3 zone.
Economic Priorities
On p7 there is a focus on the economic growth from inbound tourism. This would be a serious concern if our bushland and national parks are treated as assets for commercialisation. Sensitive natural bushland areas can easily be damaged from overuse and need protection. Private leasehold of areas with existing bushland and clearance for accommodation should not be supported.
Let’s Keep Turramurra Village Park
Ku-ring-gai Council has been developing plans to improve the Turramurra local centre over many years. As a resident of Turramurra for most of my life I can attest that the town centre has hardly changed in over 50 years.
Turramurra has the perpetual problem of being split into three sections by the railway line and Pacific Highway. There is no coherent centre for the community, just strips of shops, a couple of supermarkets and three car parks.
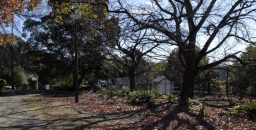
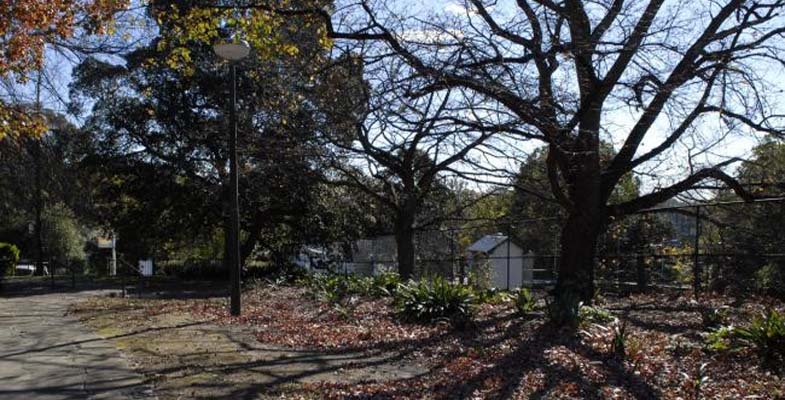
There is a small triangular park, called the Little Village Park, bordered by railway land, Pacific Highway and William Street. It is shaded by large trees that are mostly on railway land. Many of the trees are deciduous so the grass doesn’t grow very well because of the shade but it is very pleasant in all seasons. However there is little vegetation along Pacific Highway so traffic noise and pollution are not buffered. The land slopes away down to the exit from the station. There are a couple of seats but no other facilities.
The park has great potential to be a community space but council claims that it is under-utilised. Could that be because there is little amenity in its current state?
Council has developed a plan ‘to activate’ the Coles supermarket side to the west of the railway line, to be called the Turramurra Community Hub. Little Village Park was not included in the plan originally apart from funding being provided for an upgrade. (No one knows what will happen on the other side of the railway line. Woolworths did put up a proposal leading from the old post office site that remains derelict.)
However last year council proposed to add Little Village Park to the development plan by changing its current zoning as a public park (RE1) to be part of main B2 (local centre) zoning so the park could be developed as part of the Community Hub. The documents suggested a three-storey community centre be built on the land.
There was such an outcry that council held a public hearing. The independent chair recommended that the rezoning not proceed. Despite this, council staff still recommended that the rezoning could proceed and council voted 5 to 4 accordingly on 7 February.
Integration with the Rest of Turramurra
The park could possibly be integrated with development on the other side of the railway line and create a more coherent suburb. The station access bridge has been widened recently so could it be widened even more? But I am not an architect. This will not be possible once there is a large building butting alongside the avenue of trees along the railway line. This is an area with tall trees and the potential for further deep root planting.
The plans for the overall Community Hub development seem to include only concrete plazas with small trees competing with the reflective glare from all the apartment and commercial buildings. Little Village Park could remain an attractive oasis with picnic tables and a shady playground.
Is Australia Winning? (Postscript)
 The Institute for Economics and Peace has supplemented their Global Peace Index with a Positive Peace Report 2016. But be warned, at 94 pages, it’s not a light read.
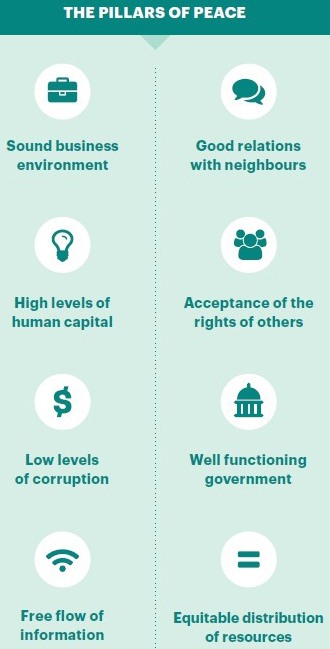
The framework used to measure positive peace is based on eight factors (pillars of peace) which are shown right, with a scoring system based on the winner having a low positive peace index (PPI) of near one (1) with others being higher.
Here are the top 15 countries in the PPI:
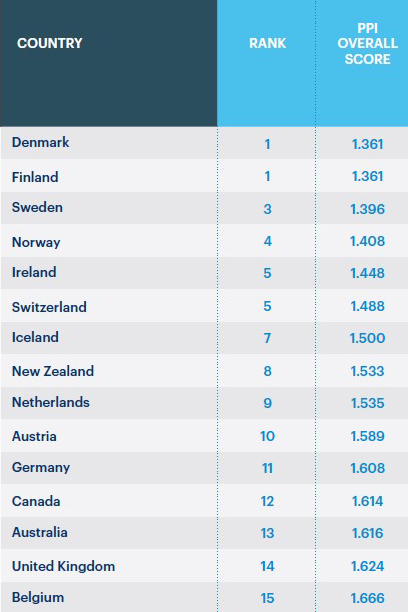
Given that the bottom countries have a PPI score greater than four, Australia’s 1.616 isn’t really too far behind the winner’s 1.361.
It’s worth looking at the winners by pillar:
| Pillar | Winner | Runnerup | Australia’s place |
| Well functioning government | Denmark | Finland | 6th |
| Low levels of curruption | New Zealand | Denmark | 7th |
| Sound business environment | Singapore | New Zealand | 3rd |
| Equitable distribution of resources | Sweden | Israel | 10th |
| Acceptance of the right of others | Sweden | Iceland | 8th |
| Free flow of information | Finland | Estonia | 19th |
| High level of human capital | United Kingdom | Ireland | 17th |
| Good relations with neighbours | Ireland | Austria | 64th |
Much as we might be discomforted by our placing in Information and Human Capital what a shocker that we could be 64th on neighbourliness.
Before we get too excited note that New Zealand is 54th which isn’t too far off our score. Does New Zealand have neighbours? One supposes so but they are all some distance away.
Page 41 documents the basis of the pillar Good Relations with Neighbours:
- hostility to foreigners- measures social attitudes toward foreigners and private property
- number of visitors- as per cent of the domestic population
- regional integration- measures the extent of a nation’s trade-based integration with other states
Number of vistors must be grossly unfair to both Australia and New Zealand because of the distance from other countries. Austria, which ranks second for neighbourliness, gets 25 million tourist arrivals a year or about 3.0 per head of population; Australia gets 7 million (less than 0.3 per head of population) source http://data.worldbank.org/indicator/ST.INT.ARVL.
One wonders if the Institute for Economics and Peace adjusts for length of stay by tourists. No one comes to our part of the world for a day or two whereas day visitors to Austria from border countries would be a significant proportion of the total.
The last item – trade integration – also raises queries. For starters is it really a matter for a ‘peace’ index? A country that promotes autarky (self-sufficiency, minimise imports) can still have peaceful relationships with neighbours even if some might be frustrated at the lack of export opportunities.
It’s a moot point whether trade data should be adjusted for the import component of exports, ie the exports have low value added if the import component is high.
Ireland ranks first under this pillar. It maybe that the main factor contributing to this is the high proportion of exports to GDP (about 40% per data published in Wikipedia) but to the extent that the exports consist of re-invoicing imports by multinationals to take advantage of Ireland’s tax competitiveness, Ireland is not a neighbourly country.
If we take out neighbourliness from the data and assume that all criteria have an equal weighting, Australia would move up to eighth position.
A quick word about other countries. The US ranks 19th, Brazil 63rd, China 85th, Russia 93rd and India 107th. Almost all the bottom countries are in Africa with Somalia the last of the 162 countries surveyed.
This a follow-up article written by Jim Wells to an article of the same name published in July 2016.
District Plans
Have your say on the North District Plan and the Greater Sydney Strategy by 31 March 2017.
District Plans cover the plan for growing Greater Sydney in detail. Sydney is divided into six districts and ours is the North District.
Increase in Number of Dwellings
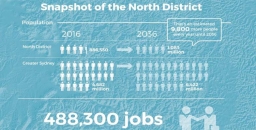
The table below summarises the implied new dwelling requirements from the population growth rates adopted in the Greater Sydney Strategy.
| Council | Existing 2011 | 2011–16 | 2016–21 | 2021–26 | 2026–31 | 2031–36 | Change 2011–36 | % change 25 years |
| Lane Cove | 13,900 | 1,650 | 1,350 | 1,250 | 1,900 | 1,900 | 8,050 | 58% |
| Ryde | 44,050 | 4,950 | 6,250 | 5,650 | 5,100 | 5,000 | 26,950 | 61% |
| Hunters Hill | 5,400 | 350 | 150 | 150 | 200 | 250 | 1,100 | 20% |
| Northern Beaches | 103,800 | 4,950 | 2,900 | 4,050 | 5,100 | 5,400 | 22,400 | 22% |
| Mosman | 13,750 | 550 | 300 | 250 | 350 | 400 | 1,850 | 13% |
| North Sydney | 37,000 | 2,950 | 2,750 | 2,700 | 3,100 | 2,900 | 14,400 | 39% |
| Willoughby | 29,050 | 1,900 | 1,200 | 1,400 | 1,850 | 2,000 | 8,350 | 29% |
| Ku-ring-gai | 41,050 | 3,150 | 2,750 | 2,850 | 3,300 | 3,250 | 15,300 | 37% |
| Hornsby | n/a as boundaries have changed | |||||||
Here is an example of how the increase in dwelling numbers could come from replacement of existing houses with higher density dwellings. If the average replacement ratio is three new dwellings for one original dwelling in Lane Cove, around 4000 existing homes (around 30% of the suburb) would be replaced by 12,000 new terraces/townhouses over 25 years.
The sheer scale of new housing and infrastructure that will be needed to accommodate the increase in population over the period 2016–36 means that the character of northern Sydney will change. That will not be the end of it. The growth is not expected to stop once 2036 is reached!
The financing for this development could create pressure for sale of public land. Alternatively it could be financed by concessions in the height and location of high-rise. Dwellings near open space (including bushland) are more valuable and provide greater capacity for ‘value capture’. We see this approach in the proposals for development in South Dural where the developer is applying for approval of six storey buildings adjoining a riparian zone.
Protection of Native Vegetation
STEP’s main area of interest is the likely impacts of extensive further development on our existing bushland and native vegetation and what the District Plans have to say about the future development and management of these areas. We are also concerned about the environment of Sydney in general with issues like:
- Will natural bushland on public and private land be maintained and improved?
- Will the green canopy cover from street trees and suburban gardens be maintained?
- Will there be sufficient wildlife corridors and preservation of habitat, eg tree hollows?
- Will the planning regulations allow developers to remove excessive amounts of vegetation?
- Will there be preparation for climate change in management of riparian zones and foreshores?
The North District Plan is a frustrating document. It makes encouraging statements but then provides little detail on how the intentions will be actioned.
It emphasises the rich natural environment of the North District located in national parks and reserves, public and private land (p131).
It states that more effective outcomes can be delivered through planning at a strategic level that:
… can consider opportunities to connect areas of biodiversity, the relationship between different areas and threats to natural features.
Does this mean considering cumulative impacts and wildlife corridors?
The future status of natural areas is unclear. Natural areas that are currently cared for under council plans of management need to continue to have protection as a special category of public land use. The Department of Planning has been reviewing the State Environment Planning Policy 19 that defines protection of urban bushland for well over a year. We should have this information by now so we know how it fits in with the District Plans. We understand that Tree Preservation Orders are included in this review.
The whole process is a quantum change from the past where a regulatory planning system, such as SEPPs protected our natural areas. We now have a strategic planning system which facilitates further development intensity and the strength of the regulatory protection is unclear.
The future conflicts are exemplified by the stated objectives of strategic conservation planning (p132), for example:
- Maintain and where possible improve the conservation status of threatened species and ecological communities.
- Achieve better outcomes for biodiversity conservation.
- Facilitate urban growth and development and reduce the cost and timeframes for development approvals.
- Provide an equitable model recognising and recovering the cost of biodiversity impacts from urban growth (the questionable offsets system).
Specific Issues
Some examples of specific issues that need to be addressed in the North District include:
- Protection of Gordon Flying Fox Reserve – flying foxes are a keystone species that are essential for the cross-pollination of native trees and their ability to adapt to climate change.
- Ensuring critically endangered ecological communities including Blue Gum High Forest and other rare vegetation are protected by the classification as Nature Reserves. These reserves are isolated pockets that are encroached by housing development. Bushland buffers need to be maintained around these endangered forest areas as well measures to ensure that the trees are not damaged by urban stormwater.
- Recognition of the special environmental attributes of the northern areas with unique vegetation arising from high rainfall and Wianamatta Shale Soils.
- The need for an upgrading of the BASIX requirements to allow for more extreme rainfall events that are accelerating damage and erosion to riparian zones. This is particularly noticeable due to the high energy water flows associated with the steep catchments in the North District.
Green Grid
The development of the Green Grid through the Metropolitan Greenspace Program is lauded by the District Plan as an important part of promoting a healthy environment. Broadly the Sydney Green Grid program is all about improving recreational spaces and their accessibility, including access to national parks. STEP is very concerned if it includes developments like bike trails through uncleared bushland, or exploitation for tourism such as leasing public land within national parks for hotels and camping areas.
The North District Plan refers to a detailed report that outlines the conceptual approach behind the Green Grid that is on the website. On enquiry we discovered that it has still not been released. Lack of key information including the changes to SEPP 19 is unacceptable and undermines the purpose of public consultation of the North District Plans.
The Greenspace program is funded by regular grants. $3 million was provided in 2015–16 and $4 million in 2016–17. $50,000 is going towards improving bush tracks in Hornsby. There is no long-term commitment to fund the program.
The North District Plan identifies some priority projects (p137). The proposal for Lane Cove River area is a concern. The description is:
Enhancing open spaces along the Lane Cove River foreshores to create unique recreational experiences linking the Lane Cove National Park to Macquarie Park. Macquarie University, Chatswood and Epping.
Will this involve clearing national park land? Currently this area of the river provides highly diverse habitat areas for native animals. On a recent STEP walk 50 native bird species were recorded. Mountain bike trails have so far been excluded from the LCNP. The area needs protection from high recreational use.
We have an opportunity now to tell the Greater Sydney Commission what is needed to ensure that Sydney’s unique environment is not destroyed by population growth.

