
STEP Matters 186
Are the Local Council Fit for the Future Reforms going too Far?
The NSW Government has been reforming the legislation governing the operation of local government under the catchy title of Fit for the Future reforms. The process started in late-2011 with the appointment of an independent local government review panel and a legislation taskforce. This process covers a lot more than the amalgamation issue.
One of the current stages (phase 1) of the reform program focuses mainly on changes to the governance and strategic business planning processes of councils. Later phases will focus on how councils raise revenue and how they exercise their regulatory functions, as well as a program of restructuring and updating the local government legislation.
A quick Google search reveals significant concerns about the current phase of the process. The Law Society and the Office of Local Government are two bodies that have expressed concern in their submissions that insufficient information is available about proposed legislation changes for a meaningful consultation to take place. The timeframes are also unrealistic. As has occurred with the amalgamation process the objective seems to be to rush through the changes so they can be implemented by about September 2016.
Many of the proposals go beyond STEP’s ambit of interest but the Ryde Hunters Hill Flora and Fauna Preservation Society has made a detailed submission that calls into question the intent of the whole process:
The Society considers that the proposed changes represent a more radical re-write of the role and purpose of local government in NSW than that of the amalgamation process. It would seem that the amalgamation debate process has exhausted and diverted local communities and their elected councillors from the legislative review.
It has distracted attention from these proposed legislative changes which will have a profound impact on the integrity of local government as a tier of government as most NSW residents understand it. In its overall intent phase 1 proposed changes could be interpreted as a cynical attempt by the State government to remove the autonomy of local government in decision-making and centralise power at a state level of government.
State of Environment Reporting
Under the current Local Government Act councils are required to include a State of the Environment Report in their annual report every four years. One particular issue raised by the Ryde Hunters Hill Flora and Fauna Preservation Society about the recent explanatory paper is the proposal to remove this requirement. Instead councils would be required to report on environmental issues relevant to the objectives established by the ‘community strategic plan’. At this stage it is not certain that there will be any provisions for the community strategic plan objectives to include environmental issues so a council would not need to budget to fund and report on environmental measures.
According to the explanatory paper this amendment is designed:
to reduce the compliance burden on councils arising from the preparation of a separate state of the environment report every four years.
It is unclear whether the reporting in the community strategic plan will relate to the council operations only and not measure aspects relating to all the residents of the council area. It is more appropriate to cover this sort of detail in a later stage of the review process.
This proposal has received very little publicity so it slipped through our radar.
State of the Environment (SoE) reporting is an essential requirement for understanding the incremental changes that are happening to our environment as the population juggernaut continues to invade Sydney. SoE reports provide a consistent and efficient framework for on-going environmental monitoring and reporting and necessitate timely appraisal of how councils are meeting vital goals. They provide a mechanism to feed into regional environmental planning processes. The information gathered can be integrated into council’s operational and strategic planning processes. This ensures that councils meet their responsibilities as natural resource managers.
NSROC SOE Report 2011–12
An example of the regional reporting is the Northern Sydney Regional Organisation of Councils (NSROC) combined report that provides a comprehensive snapshot. As the report states:
The Regional SoE Report allows NSROC communities … to have a broader understanding of water, air, biodiversity, waste, noise, heritage and planning issues and serves to enhance coordination between councils.
Here is a summary of some data from the 2011–12 report, the most recent available.
| Council | Hornsby | Ku-ring-gai | Ryde | Willoughby | North Sydney | Total |
| Approx population (thousands) | 164 | 114 | 106 | 71 | 65 | 567 |
| Residential energy (MWh/capita) | 2.8 | 3.61 | 2.58 | 2.75 | 2.92 | 2.99 |
| Water (kL per capita) | 80 | 88 | 98 | 114 | 107 | 98 |
| Waste to landfill (kg/capita) | 210 | 197 | 227 | 180 | 123 | 170 |
| Waste recycled (kg/capita) | 118 | 303 | 204 | 272 | 151 | 229 |
Bushcare volunteer hours have reduced from the previous year by 10% to 41,782. If these hours are valued at $25 per hour this equated to over $1million of free labour.
Residential energy consumption is going down, probably thanks to the solar panels on lots of roofs. Exported solar power in the region has grown from 219 MWh in 2007–8 to 15,473MWh in 2011–12.
Water consumption is reducing. But waste generation is a different story. The amount going to landfill continues to increase while there is also more being recycled.
There are some surprising variations in performance on a per capita basis between council areas which makes one wonder about the consistency of data definitions and/or collection methods.
Threats to Remove Tax Deductibility from Donations to Environment Groups Could Become a Reality

On 4 May 2016, the Senate Standing Committee on the Environment tabled a report on its inquiry into the Register of Environmental Organisations. Maybe it was hoped that with all the attention being given to the Budget, no one would notice.
The rhetoric from LNP politicians presaged the political agenda behind the inquiry such as the accusations by the Attorney General, George Brandis that environmental organisations (EOs) are destroying jobs. The implications were that the objective of the inquiry is to justify the removal of tax free donation status of environmental charities. The terms of reference for the enquiry related mainly to administrative aspects of the REO but included an examination of:
activities undertaken by organisations currently listed on the Register and the extent to which these activities involve on-ground environmental works
Under the Income Tax Assessment Act 1997 (Cth) an environmental organisation that is given Deductible Gift Recipient (DGR) status is required to have a principal purposeof:
- the protection and enhancement of the natural environment or of a significant aspect of the natural environment;or
- the provision of information or education, or the carrying on of research, about the natural environment or a significant aspect of the naturalenvironment.
Note the or above and yet the terms of reference focused on ‘on-ground’ works.
The inquiry received hundreds of submissions, held hearings and studied the activities of some EOs on the ground. They observed that:
Broadly speaking, the activities of environmental DGRs can be summarised under four categories:
- environmentalremediation
- education andresearch
- policy advocacy and representation
- other activities including those carried outoverseas
The committee acknowledged the significant and ongoing contribution of environmental charities to the protection and enhancement of the natural environmental in all states and territories. However the report stated that:
Having regard to the terms of reference of the inquiry, the committee is of the view that the purpose of granting DGR status to environmental organisations should be to support practical environmental work in the community.
They then have taken a very narrow interpretation of the meaning of ‘practical’. The significant recommendation is that:
… legislative and administrative changes be pursued by the Australian Taxation Office to require that the value of each environmental deductible gift recipient’s annual expenditure on environmental remediation work be no less than 25% of the organisation’s annual expenditure from its publicfund.
The committee accepted that definitional issues may arise from this recommendation. The committee’s view is that remediation work should include revegetation, wildlife rehabilitation, plant and animal pest control, land management and covenanting. Activities such as education, research, advocacy, legal services, activities involved in representing member organisations and activities carried out overseas should not qualify as remediation work.
The government report maintained that the recommended restriction would not impede the ability of EOs to carry our advocacy work.
The Labor Party senators published a dissenting viewpoint. Here are a few quotes from their report:
The overwhelming weight of evidence presented to the committee points to the vital importance of maintaining the tax deductibility of donations to environmental organisations, without imposing further conditions or constraints on the operation of those organisations.
Despite the efforts of government members, no disinterested evidence was adduced in support of the proposition that a distinction should be drawn between so-called ‘on ground’ environmental activities on the one hand, and advocacy, on the other.
In these circumstances, the Labor members of the committee find it extraordinary that government members have recommended to, in effect, constrain the capacity of environmental organisations to engage in advocacy work. We completely reject this undemocratic proposition. Citizens should be supported to question government decision-making and corporate power, not manoeuvred into silence by legislative and administrative action.
The dissenting report also pointed out that the recommendation would create additional red tape for both the environmental organisation and the Taxation Office in collecting information required to check that the organisations are complying with the requirement. Why should EOs be treated differently to other not-for-profit charities?
In STEP’s view it is totally unfair to propose such restrictions on the ability of EOs to raise funds while the corporate sector is free to lobby in their own interests and the expenditure incurred is tax deductible. EOs are acting in the interests of current and future generations to preserve a world that is being destroyed by government and corporate short term interests.
Example – longwall mining under Sydney’s water catchment – more longwalls would probably be approved by now if environment groups had not done such detailed research to highlight the issue. The authorities now recognise now serious the risks are of major loss of water flows and contamination.
STEP’s Environmental Protection Fund does have DGR status so we will need to review our position if and when any changes are made to the legislation.
Is Australia Winning?
Everyone likes a race; whether it’s the Melbourne Cup, some sporting event or an election. Winning is fabulous, losing can be character building.
Prosperity Index
There crossed my desk (iPad) the other day the Prosperity Index produced by the Legatum Institute based in London.
Table 1 gives a listing for 2015 of the top ten countries, the bottom ten (of 142) and for interest the United States and the United Kingdom.
The scoring is based on eight sub-indices. Australia’s ranking together with Norway (the overall winner) is shown in Table 2, together with the sub-index winners.
Table 1 Prosperity Index
| Country | Rank | Score |
| Norway | 1 | 3.50 |
| Switzerland | 2 | 3.34 |
| Denmark | 3 | 3.27 |
| New Zealand | 4 | 3.25 |
| Sweden | 5 | 3.22 |
| Canada | 6 | 3.19 |
| Australia | 7 | 3.09 |
| Netherlands | 8 | 3.05 |
| Finland | 9 | 3.01 |
| Ireland | 10 | 2.97 |
| United States | 11 | 2.93 |
| United Kingdom | 15 | 2.72 |
| Angola | 133 | (2.55) |
| Sudan | 134 | (2.55) |
| Yemen, Republic | 135 | (2.60) |
| Syrian Arab Republic | 136 | (2.61) |
| Congo, Democratic Republic | 137 | (2.66) |
| Burundi | 138 | (2.67) |
| Chad | 139 | (2.77) |
| Haiti | 140 | (2.82) |
| Afghanistan | 141 | (2.94) |
| Central African Republic | 142 | (3.55) |
Table 2 Prosperity sub-index rankings for Australia and Norway and overall winner
| Sub-index | Rank | Winner (rank 1) | |
| Australia | Norway | ||
| Economy | 12 | 4 | Singapore |
| Entrepreneurship and opportunity | 14 | 5 | Sweden |
| Governance | 10 | 8 | Switzerland |
| Education | 1 | 5 | Australia |
| Health | 15 | 4 | United States |
| Safety and security | 15 | 8 | Hong Kong SAR |
| Personal freedom | 9 | 3 | Canada |
| Social capital | 4 | 2 | New Zealand |
Look, we’ve won something; numero uno in education. Sorry to disappoint those of you in teaching but the sub-index is based on some statistical data like school attendance but without any reference to performance. More on this later.
Indeed I am not sure that education should have any place in this index. Education is all about future prosperity, not today’s.
One has to be sceptical that the United States is worthy of first place in health. This placing is almost certainly heavily influenced by expenditure per person which, for the United States, is more a reflection of high incomes for medicos rather than outcomes. The United States is the only OECD country without universal health care.
Drilling down into the detail is a fascinating yet frustrating experience. The economy sub-index doesn’t even include GDP per head or any other measure of income. The social capital sub-index is based totally on survey questions such as Donated money to charity in the past month? That is a meaningless question to ask simple villagers in a subsistence agricultural environment still common in the third world.
Human Development Index
Turning now to the United Nation’s Human Development Index Australia’s position looks much better (see Table 3).
Again, we are doing battle with Norway:and that country almost certainly wins because of the much higher gross national income due to North Sea oil. The data is for 2014; there has been a significant reduction in oil prices since.
Table 3 Human Development Index (HDI) 2014 rankings
| Country | Rank | HDI |
| Norway | 1 | 0.944 |
| Australia | 2 | 0.935 |
| Switzerland | 3 | 0.930 |
| Denmark | 4 | 0.923 |
| Netherlands | 5 | 0.922 |
| Germany | =6 | 0.916 |
| Ireland | =6 | 0.916 |
| United States | 8 | 0.915 |
| Canada | =9 | 0.913 |
| New Zealand | =9 | 0.913 |
| United Kingdom | 14 | 0.907 |
Strange is expected years of schooling (20.2 years for Australia and 17.5 years for Norway) which the United Nations says is:
The number of years of schooling that a child of school entrance age can expect to receive if prevailing patterns of age specific enrolment rates persist throughout the child’s life.
For this to be 20.2 years for Australia it looks like we are going to have most of the population between 20 and 25 studying for higher degrees at universities. This is ridiculous. It won’t happen.
Global Competitive Index
Now for a reality check. A very highly respected ranking is the World Economic Forum’s (Davos) Global Competitive Index.
Oh dear. We are a lowly 21st, even outranked by Malaysia (see Table 4). It must be made clear that this index is somewhat different to the others mentioned. From the report:
We define competitiveness as the set of institutions, policies, and factors that determine the level of productivity of a country. The level of productivity, in turn, sets the level of prosperity that can be reached by an economy.
My take on this is that it is attempting to measure things that determine prosperity, not prosperity itself.
The index has twelve pillars. Table 5 shows our rankings compared to the top three countries.
Table 4 Global Competitive Index 2015–16 rankings and 2014–15 comparisons
| Country | 2015–16 | 2014–15 | |
| Rank | Score | Rank | |
| Switzerland | 1 | 5.76 | 1 |
| Singapore | 2 | 5.68 | 2 |
| United States | 3 | 5.61 | 3 |
| Germany | 4 | 5.53 | 5 |
| Netherlands | 5 | 5.50 | 8 |
| Japan | 6 | 5.47 | 6 |
| Hong Kong SAR | 7 | 5.46 | 7 |
| Finland | 8 | 5.45 | 4 |
| Sweden | 9 | 5.43 | 10 |
| United Kingdom | 10 | 5.43 | 9 |
| Norway | 11 | 5.41 | 11 |
| Denmark | 12 | 5.32 | 13 |
| Canada | 13 | 5.31 | 15 |
| Qatar | 14 | 5.30 | 16 |
| Taiwan | 15 | 5.28 | 14 |
| New Zealand | 16 | 5.25 | 17 |
| United Arab Emirates | 17 | 5.24 | 12 |
| Malaysia | 18 | 5.23 | 20 |
| Belgium | 19 | 5.20 | 18 |
| Luxembourg | 20 | 5.20 | 19 |
| Australia | 21 | 5.15 | 22 |
Table 5 GCI 2015–16 comparison of rankings between Australia, Switzerland, Singapore and United States
| Pillars | Ranking | |||
| Australia | Switzerland | Singapore | United States | |
| 1 Institutions | 19 | 7 | 2 | 28 |
| 2 Infrastructure | 16 | 6 | 2 | 11 |
| 3 Macroeconomic environment | 28 | 6 | 12 | 96 |
| 4 Health and primary education | 9 | 11 | 2 | 46 |
| 5 Higher education and training | 8 | 4 | 1 | 6 |
| 6 Goods market efficiency | 27 | 9 | 1 | 16 |
| 7 Labour market efficiency | 36 | 1 | 2 | 4 |
| 8 Financial market development | 7 | 10 | 2 | 5 |
| 9 Technological readiness | 21 | 2 | 5 | 17 |
| 10 Market size | 22 | 39 | 35 | 2 |
| 11 Business sophistication | 27 | 1 | 18 | 4 |
| 12 Innovation | 23 | 1 | 9 | 4 |
Table 6 GCI 2015–16 comparison of macroeconomic environments between Australia, Switzerland, Singapore and United States
| 3rd pillar: Macroeconomic environment | Ranking | |||
| Australia | Switzerland | Singapore | United States | |
| 3.01 Government budget balance (% GDP) | 83 | 21 | 6 | 114 |
| 3.02 Gross national savings (% GDP) | 46 | 16 | 5 | 87 |
| 3.03 Inflation (annual % change) | 1 | 64 | 1 | 1 |
| 3.04 Government debt (% GDP) | 48 | 77 | 127 | 129 |
| 3.05 Country credit rating | not show | not show | not show | not show |
| Overall macroeconomic environment | 28 | 6 | 12 | 96 |
Questions, questions, questions – many could be asked. An enormous amount of data is available to drill down into.
To take one aspect. The United States rates well on market size but why should Switzerland and Singapore be marked down because they are small? They both have good access to enormous nearby markets and in this day and age of low freight costs having a small domestic market doesn’t matter all that much.
Contrary to Legatum’s Prosperity Index Australia does not rank so well on education. For the fifth pillar Singapore is first, followed by Finland. We do well on secondary enrolment but badly on quality of the education system and quality of math and science education.
The United States and ourselves rank poorly on macroeconomic environment (see Table 6).
Measuring some of these items is fraught with difficulty and weighting them in an index can only be quite subjective. Switzerland’s inflation rate in 2015–16 was negative which must account for its poor ranking.
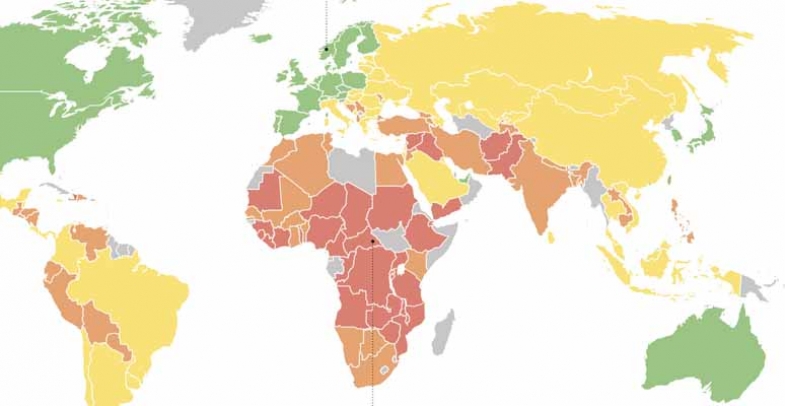
Global Peace Index
Last of our rankings is the Global Peace Index. This has a world-wide reputation but is of special interest to Australians as it is the brainchild of Australian technology entrepreneur Steve Killelea.
Table 7 shows the 2015 rankings – the top ten, Norway, United Kingdom and the United States, and the bottom three.
The report provides a very useful commentary on trends. It is peculiar that the United Kingdom’s ranking should improve with the withdrawal of its troops from Afghanistan; surely their presence there was a contributor to peace.
One wonders how well correlated peace and prosperity are. Quite closely one would have thought as countries that are not prosperous are very prone to internal strife.
It’s a pity that downloadable data is not available for analysis. The report though contains much useful information.
No matter what our ranking by the pundits, Australia is a good place to live. We have generally pleasant weather and those wanting space in the form of suburban houses with some land can find it at reasonable prices (not true of Singapore, for instance) and still access work and all the amenities that a city typically offers within reasonable travel times. Whether that is environmentally sustainable is a matter for debate.
Table 7 Global Peace Index 2015
| Rank | Country | Score |
| 1 | Iceland | 1.148 |
| 2 | Denmark | 1.150 |
| 3 | Austria | 1.198 |
| 4 | New Zealand | 1.221 |
| 5 | Switzerland | 1.275 |
| 6 | Finland | 1.277 |
| 7 | Canada | 1.287 |
| 8 | Japan | 1.322 |
| 9 | Australia | 1.329 |
| 10 | Czech Republic | 1.341 |
| 17 | Norway | 1.393 |
| 39 | United Kingdom | 1.685 |
| 94 | United States | 2.038 |
| 160 | Afghanistan | 3.427 |
| 162 | Iraq | 3.444 |
| 163 | Syria | 3.645 |
By Jim Wells
So-called Biodiversity Reforms are not Fit for Purpose
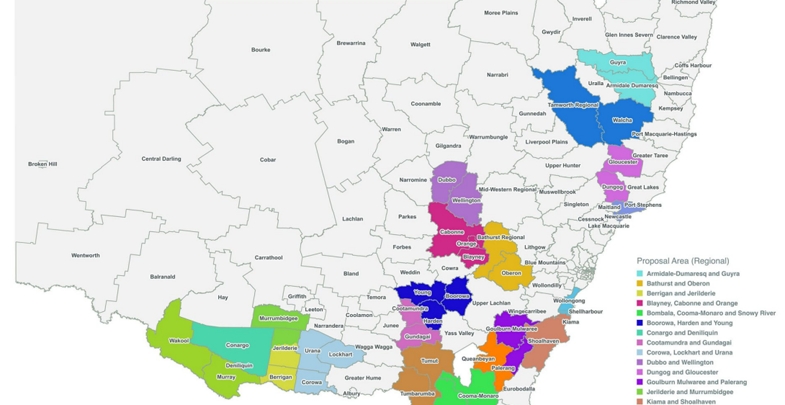
The NSW government has been undertaking a major review of the biodiversity legislation in response to farmers’ complaints about the fairness and processes of the current land clearing laws. This has involved the appointment of an independent review panel whose report was released in December 2014. The report covered a lot more than rural land clearing laws and proposed a major revamp of the biodiversity protection provisions.
STEP Matters Issue 183 explained some of the concerns about the recommendations of the report, particularly the:
- use of self-assessment
- watering down of biodiversity offset standards
- reliance on private land conservation
- adequacy of provisions and resources to assess and monitor vegetation clearing
The recommendations, if adopted, would seriously undermine protections that currently limit development that is likely to lead to loss of biodiversity in rural and urban areas.
Prior to the 2015 election the NSW government promised to implement all recommendations of the report. Conservation groups have been calling on the general public to express their concerns to their local MPs in the hope that the actual legislation would recognise the issues raised but to no avail. The usual response was a standard email full of statements about the glorious improvement in biodiversity that was going to occur and made no acknowledgement of the concerns.
The Office of Environment and Heritage (OEH) set out to consult with key stakeholder groups such as the NPA and NCC on the drafting of the legislation. The process was such a sham that the groups withdrew from the process in February 2016. The groups issued this joint statement about the withdrawal:
We have provided detailed analysis and constructive feedback to help develop a conservation law that addresses the increasing threats to wildlife, soils and climate, but it is now clear that the government is on a course to pursue development at high environmental cost.
Direct talks with the relevant ministers also seem to have fallen on deaf ears.
On 6 May the draft legislation was released. The closing date for submissions was 28 June.
Application to Urban Areas and Tree Preservation Orders are still Unclear
Some aspects of the application of the legislation to urban areas are not yet clear. A new State Environmental Planning Policy and Development Control Plan for urban areas are yet to be released for consultation that will define the clearing controls and consent requirements. In fact it is not clear what consultation will occur.
Of particular concern is the proposal to replace individual council Tree Preservation Orders (TPOs) with a SEPP to apply to all urban areas. TPOs are an effective tool for protecting urban trees and their associated biodiversity, amenity, heritage, shade and heat reduction values. TPOs need to take into account differences in the characteristics of urban areas such as topography, existing canopy cover and proximity to bushland.
No clear justification for the proposed replacement of TPOs with a SEPP and the purported benefits of this approach has been provided. The Final Report from the Independent Biodiversity Legislation Review Panel does not address TPOs at all.
Response to Draft Legislation
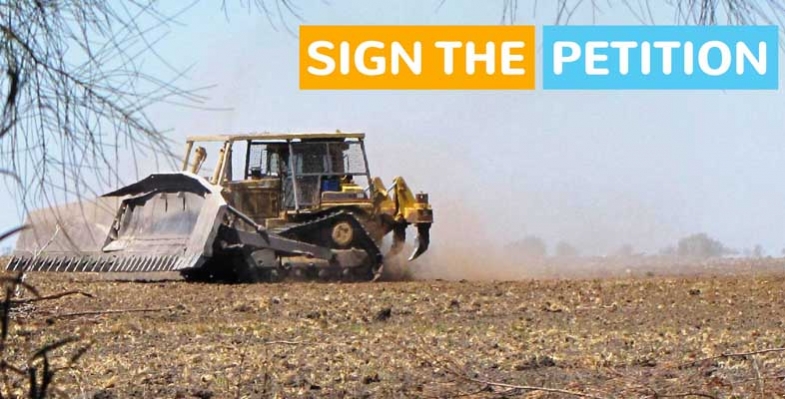
A major campaign (Stand Up for Nature) was launched by a coalition of conservation groups to inform the public urging us to contact politicians to express opposition and ask for the legislation to be withdrawn. The campaign has been very successful. Over 5,400 submissions have been made opposing the legislation.
On top of this response, just last week a group of over 400 scientists released a declaration expressing concern about the current and likely future rate of deforestation and loss of habitat and its impact on threatened species.
The government wants to pass the legislation in October. They appear to be determined to ignore expert opinion. Future generations will face the consequences. Pressure needs to be maintained on the premier to modify the draft legislation.
Government Statements are Pure Spin
Here are three examples of the disconnect between the government’s statements on the OEH website about the reforms and the likely outcomes according to assessments by the Environmental Defenders Office (EDO), conservation groups and STEP.
Read EDO’s comprehensive analysis.
1. OEH statement on ecologically sustainable development (ESD)
The biodiversity reforms will facilitate ESD in NSW. The introduction of a new biodiversity offsets scheme, including the new Biodiversity Conservation Trust and an expanded biodiversity certification program will, for the first time, deliver a transparent, consistent and certain approach to biodiversity assessment and offsetting in NSW.
Comment
ESD is a basic objective of the current planning legislation. Its application in the past has led to genuine offsetting decisions such as the provision of funding for preservation of Blue Gum High Forest land in Browns Forest, St Ives to offset BGHF cleared for railway expansion in Hornsby.
Under this heading the OEH identifies the flawed biodiversity offset system as the means of facilitating ESD. The idea seems to be that merely making statements about ESD will make it happen. How can biodiversity be maintained or improved when a developer will be able to pay money into a fund if suitable vegetation for offsetting is not available.
The proposed reforms ignore the principles of ESD; they do not take a precautionary approach; they do not treat biodiversity conservation as a fundamental consideration in decision-making; and they are very unlikely to achieve intergenerational equity.
2. OEH statement that reforms will enhance biodiversity conservation on private land
Comment
The proposed regime places almost complete reliance on political, budgetary decisions (which may be short-term) to achieve biodiversity gains, rather than on protections to prevent continued biodiversity decline.
Who knows whether private landowners will be given sufficient long-term support to carry out conservation on their land?
Programs like the Saving our Species will fund measures to restore habitat for identified threatened species. But at the same time land clearing will be allowed that will destroy habitat for a lot more species. It is much more expensive to restore habitat than to preserve it in the first place.
3. OEH statement that the reforms will set and achieve clear biodiversity objectives
- The objects of the draft Bill emphasise conserving biodiversity and ecological integrity at bioregional and state scales and facilitating ecologically sustainable development.
- The draft Bill objects for improving and sharing knowledge about biodiversity, ecosystem services and conservation actions will be achieved through an environmental monitoring, assessment and reporting program to be established by OEH.
The reform package will deliver balanced legislation and positive outcomes for all stakeholders. Landholders will no longer be the sole party responsible for conservation outcomes and will be able to undertake legitimate land clearing and management activities unhindered. The environment will benefit from significant new investment focused on priority threatened species and priority conservation areas.
Comment
As the EDO points out:
There are no clear environmental baselines, aims or targets. There is no ban on broad-scale clearing, no mandatory soil, water and salinity assessment, and no ‘maintain-or-improve’ standard to ensure environmental outcomes – either at the site scale or at the landscape scale. Provisions are less stringent, less evidence-based, less accountable, and are likely to result in significant clearing increases in NSW.
The government has made no attempt to quantify the extra amount of land clearing that is likely to occur.
Vale Hugh Roberts

Former NSW Crown Solicitor, Hugh Roberts, was treasurer of STEP from 1996 to 2001. In this period STEP began its biggest ever publications fling, turning itself almost into a small business with the release of the Lane Cove bushwalking maps. The calm and business-like way Hugh carried this extra load was inspirational and made it so much easier for the rest of committee to get on with what each did best. In the complex world of environmentalism in an urban setting, it was comforting also to be assured of his wisdom during the many land versus environment conflicts that went on around us.
Hugh was for many years on the board of Australia's preeminent classical and contemporary a cappella group, the Song Company, and was also a long-time amateur classical pianist and ensemble musician himself.
He was a great guy, so easy to deal with and work with, and with his musical skills and his intense interest in all things environmental, legal and political, he was the nearest thing to a Renaissance man that STEP committee has been blessed with.
When Hugh knew beyond reasonable doubt that he was afflicted by Alzheimer's, friends and family obviously hoped and prayed that the doctors and specialists could be wrong. But he somehow knew the inevitability of the diagnosis and calmly accepted and dealt with it as best he could.
STEP's fond thoughts, memories and condolences go especially to his wife, Hilary, and also to his friends and to the many other members of his family. We shall miss him.
By John Martyn
Thirlmere Lakes, Perhaps another Victim of Longwall Mining
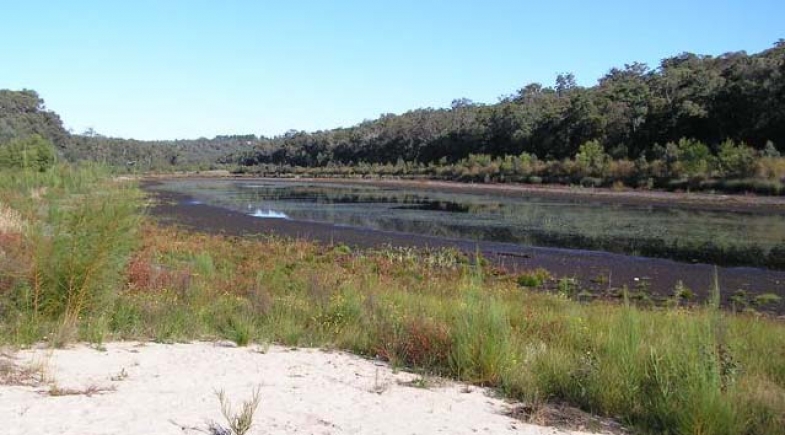
The previous issue of STEP Matters 185 described the risks to Sydney’s water catchment in the Illawarra region from longwall mining. Research is now pointing to mining also being a culprit in the drying out of Thirlmere Lakes. Thirlmere Lakes National Park is part of the Blue Mountains World Heritage Area. The two largest of the five lakes are currently empty and the other three are depleted.
The report, published by the UNSW Centre for Ecosystem Science, found that the dropping of water levels coincided with the onset of longwall coal mining in the mid-1980s, with the lakes having continued to dry out since then. Longwall coal mining is thought to have fractured the aquicludes that constrain the groundwater aquifers, causing diversion of groundwater resources. Another factor could also be considerable pumping of groundwater.
The report's findings contradict a 2013 NSW Government Commission of Inquiry which stated that:
… changes in the water levels in Thirlmere Lakes over the past 40 years are due to climatic variations such as droughts and floods.
The recent heavy rain that has led to nearby Warragamba Dam almost overflowing has had very little impact on the water levels in the lakes.
Commenting of the report, UNSW wetland ecologist Prof Richard Kingsford said gum trees were encroaching on the dry lakes. ‘What we are seeing here in terms of the vegetation is the slow death of a wetland,’ he said.
The Thirlmere Lakes are the 15-million-year-old remnants of a river whose original flow direction was stalled and gently reversed by mild tectonic tilting, and according to Prof Kingsford, hold a rich geology. The implications are significant for the ecological character of the Thirlmere Lakes.
There are many affected obligate aquatic species or species reliant on wet habitats, including:
- five species of waterbirds (Australasian Bittern Botaurus poiciloptilus, Australian Painted Snipe Rostratula australis, Great Egret Ardea alba, Cattle Egret Ardea ibis and Latham’s or Japanese Snipe Gallinago hardwickii)
- one fish species (Macquarie perch Macquaria australasica)
- two frog species (giant burrowing frog Heleioporus australiacus, Littlejohn’s tree frog Litoria littlejohni)
- three plant species (smooth bush pea Pultenaea glabra, Kangaloon sun orchid Thelymitra Kangaloon and the aquatic water shield Brasenia schreberi) that are listed as threatened
Interestingly, Thirlmere also carries the freshwater sponge Radiospongilla sceptroides.
The report has serious implications for governments and their responsibilities for managing the values of Thirlmere Lakes National Park along with the Blue Mountains World Heritage Area. These major changes in flooding regimes to Thirlmere Lakes will continue to degrade the Thirlmere Lakes National Park and its ecological, cultural and recreational values. The lakes were once popular with swimmers and canoeists.
Mine owner, Glencore announced in June that operations will be reduced and the mine will be closed in 2019 as a result of low coal prices. The local Wollondilly Council and Friends of Thirlmere Lakes are calling for action to restore the Lakes. Council has suggested that artificial injection of fresh water should be considered. It is a theory supported by groundwater expert Dr Philip Pells, who said recovery of the water table may otherwise take decades.
‘It's not beyond the realm of possibility to pump water up from Warragamba Dam, cycle it back through here, and it goes back down to Warragamba Dam,’ Dr Pells said.
Senate Committee Recommends a Ban on Plastic Bags – Can this Happen?
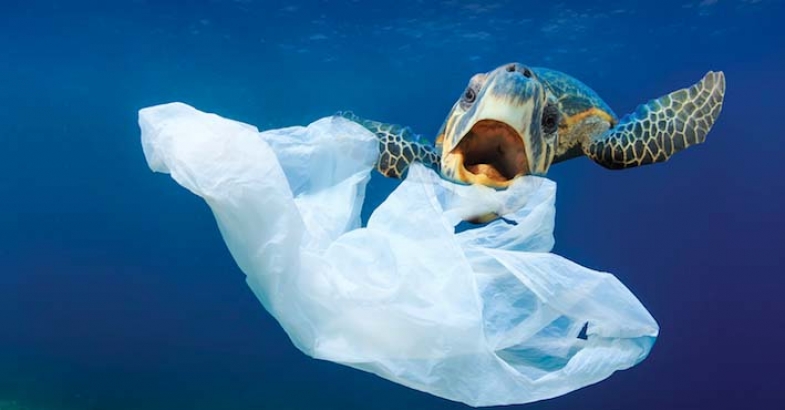
Good news, a container deposit scheme is going to happen. The NSW Premier announced on 8 May that a scheme based on the Boomerang Alliance’s proposal would be introduced on 1 July 2017. Mike Baird claimed this would be a world-class scheme. The ACT will use the same scheme and Queensland could be on board as well.
This decision will be a major step in reducing the volume of plastic pollution that ends up in our waterways and oceans. The other major source is single use plastic bags. We wrote about this issue in STEP Matters Issue 182.
The Australian government is aware of the problem. On 18 June 2015 the Senate referred the following matter for inquiry and report by April 2016 by the Standing Committee on Environment and Communications.
The threat of marine plastic pollution in Australia and Australian waters, with particular reference to:
- the review of current research and scientific understanding of plastic pollution in the marine environment
- sources of marine plastic pollution
- the impacts of marine plastic pollution, including impacts on species and ecosystems, fisheries, small business, and human health
- measures and resourcing for mitigation
In their report the committee noted that, while there may be the lack of rigor of some of the estimates of the amount of plastic in the marine environment (after all it can only be calculated using some sort of sampling process) they are still sobering: five trillion plastic pieces on the surface of the oceans; eight million tonnes of plastics leaking into the ocean every day – that is the equivalent of one garbage truck of plastic every minute of every day of the year.
Not only is this volume of plastic a significant threat to the health of marine life. The committee was considerably alarmed to hear that the potential effect on human health from the ingestion of microplastics in the food chain is only now emerging as an area of research interest. The committee is concerned that there may be a looming health crisis associated with seafood consumption, and urges the prioritisation of research on this issue, and appropriate investment from both government and industry. The committee also considers that microplastics warrant specific focus in strategies aimed a mitigating the effects of marine plastic.
The report called for state and territory bans on plastic bags, an immediate ban on microbeads and the introduction of container deposit schemes across the country by 2020.
There are still many unnecessary waste issues to be addressed such as the so-called flushable wipes that clog up sewerage systems and take away coffee cups. Most of these changes require a change of mindset. The environment needs to be given more priority than convenience.
Recycling Scheme for Paint – PaintBack

Australians buy more than 100 million litres of paint each year but around 5% of it ends up as waste, making paint and its packaging one of the biggest source of liquid waste into landfill. Paint contains chemicals such as volatile organic compounds and metals that can contaminate our groundwater and endanger human health. It is important to not put these items into your garbage bin.
Currently householders can take their leftover paint to collection centres set up every six months or so by local councils. Often the Clean Up Day is missed. Meanwhile the old paint tins accumulate in the storage sheds. The alternative is waste collection centres but they cost about $4.50 per litre tin, no matter how full.
A world first program, called Paintback, has been launched recently to offer professional and home painters an easy option for disposing of unwanted paint and packaging correctly. It expects to keep more than 45,000 tonnes out of landfill over the next five years.
To fund it, the paint manufacturers will add 15 cents a litre to the wholesale price of their products. There will be no further charge for anyone to dispose of paint at any designated collection point.
Paintback, a not-for-profit company, has ACCC regulatory approval to apply the waste levy and the support of Australian, state and territory governments. States and Territories have agreed to amend environmental regulations to allow trade painters to use the same scheme as DIY painters.
About 70 paint-specific collection points will be established over the next two years – starting with 12 in capital cities through a partnership with Cleanaway, which provides the expertise and a significant national footprint to collect and treat the waste paint and packaging. Existing council waste management centres also will be invited to participate.
The industry will fund research to find better uses for unwanted paint. Uses for waste paints could include extracting fossil fuels for energy consumption. The steel and plastic packaging is also recycled into new products.