
STEP Matters 191
- Default
- Title
- Date
- Random
- In May the NSW government released regulations and codes that provide some of the detail on how the biodiversity legislation…Read More
- Over the past 200 years NSW has lost almost half of its bushland through land clearing and only 9% of…Read More
- Ku-ring-gai Council is anticipating that there will be a strong demand for biodiversity offsets once biodiversity legislation comes into operation…Read More
- STEP is supporting a great initiative by organised by Forestmedia, a small not-for-profit organisation that is aiming to increase community…Read More
- The Australian and Queensland governments are still pushing for the Adani mine to go ahead and are bending over backwards…Read More
- Lord Howe Island is a magnificent island about 600 km off the coast of NSW. Its unique landform as an…Read More
- There has been much media interest in the report that Sydney's population has reached 5 million. What has also been…Read More
- Our economy and society ultimately depend on natural resources: land, water, material (such as metals) and energy. But some scientists…Read More


The Decoupling Delusion: Rethinking Growth and Sustainability
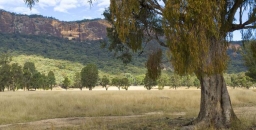
Our economy and society ultimately depend on natural resources: land, water, material (such as metals) and energy. But some scientists have recognised that there are hard limits to the amount of these resources we can use. It is our consumption of these resources that is behind environmental problems such as extinction, pollution and climate change.
Even supposedly 'green' technologies such as renewable energy require materials, land and solar exposure, and cannot grow indefinitely on this (or any) planet.
Most economic policy around the world is driven by the goal of maximising economic growth (or increase in gross domestic product – GDP). Economic growth usually means using more resources. So if we can’t keep using more and more resources, what does this mean for growth?
Most conventional economists and policymakers now endorse the idea that growth can be 'decoupled' from environmental impacts – that the economy can grow, without using more resources and exacerbating environmental problems.
Even the then US president, Barack Obama, in a recent piece in Science argued that the US economy could continue growing without increasing carbon emissions thanks to the rollout of renewable energy.
But there are many problems with this idea. In a recent conference of the Australia-New Zealand Society for Ecological Economics (ANZSEE), we looked at why decoupling may be a delusion.
The Decoupling Delusion
Given that there are hard limits to the amount of resources we can use, genuine decoupling would be the only thing that could allow GDP to grow indefinitely.
Drawing on evidence from the 600-page Economic Report to the President, Obama referred to trends during the course of his presidency showing that the economy grew by more than 10% despite a 9.5% fall in carbon dioxide emissions from the energy sector. In his words:
…this 'decoupling' of energy sector emissions and economic growth should put to rest the argument that combating climate change requires accepting lower growth or a lower standard of living.
Others have pointed out similar trends, including the International Energy Agency which last year – albeit on the basis of just two years of data – argued that global carbon emissions have decoupled from economic growth.
But we would argue that what people are observing (and labelling) as decoupling is only partly due to genuine efficiency gains. The rest is a combination of three illusory effects: substitution, financialisation and cost-shifting.
Substituting the Problem
Here’s an example of substitution of energy resources. In the past, the world evidently decoupled GDP growth from buildup of horse manure in city streets, by substituting other forms of transport for horses. We’ve also decoupled our economy from whale oil, by substituting it with fossil fuels. And we can substitute fossil fuels with renewable energy.
These changes result in 'partial' decoupling – that is, decoupling from specific environmental impacts (manure, whales, carbon emissions). But substituting carbon-intensive energy with cleaner, or even carbon-neutral, energy does not free our economies of their dependence on finite resources.
Let’s get something straight: Obama’s efforts to support clean energy are commendable. We can – and must – envisage a future powered by 100% renewable energy, which may help break the link between economic activity and climate change. This is especially important now that President Donald Trump threatens to undo even some of these partial successes.
But if you think we have limitless solar energy to fuel limitless clean, green growth, think again. For GDP to keep growing we would need ever-increasing numbers of wind turbines, solar farms, geothermal wells, bioenergy plantations and so on – all requiring ever-increasing amounts of material and land.
Nor is efficiency (getting more economic activity out of each unit of energy and materials) the answer to endless growth. As some of us pointed out in a recent paper, efficiency gains could prolong economic growth and may even look like decoupling (for a while), but we will inevitably reach limits.
Moving Money
The economy can also appear to grow without using more resources, through growth in financial activities such as currency trading, credit default swaps and mortgage-backed securities. Such activities don’t consume much in the way of resources, but make up an increasing fraction of GDP.
So if GDP is growing, but this growth is increasingly driven by a ballooning finance sector, that would give the appearance of decoupling.
Meanwhile most people aren’t actually getting any more bang for their buck, as most of the wealth remains in the hands of the few. It’s ephemeral growth at best: ready to burst at the next crisis.
Shifting the Cost onto Poorer Nations
The third way to create the illusion of decoupling is to move resource-intensive modes of production away from the point of consumption. For instance, many goods consumed in Western nations are made in developing nations.
Consuming those goods boosts GDP in the consuming country, but the environmental impact takes place elsewhere (often in a developing economy where it may not even be measured).
In their 2012 paper, Thomas Wiedmann and co-authors comprehensively analysed domestic and imported materials for 186 countries. They showed that rich nations have appeared to decouple their GDP from domestic raw material consumption, but as soon as imported materials are included they observe 'no improvements in resource productivity at all'. None at all.
From Treating Symptoms to Finding a Cure
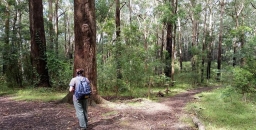
One reason why decoupling GDP and its growth from environmental degradation may be harder than conventionally thought is that this development model (growth of GDP) associates value with systematic exploitation of natural systems and also society. As an example, felling and selling old-growth forests increases GDP far more than protecting or replanting them.
Defensive consumption – that is, buying goods and services (such as bottled water, security fences, or private insurance) to protect oneself against environmental degradation and social conflict – is also a crucial contributor to GDP.
Rather than fighting and exploiting the environment, we need to recognise alternative measures of progress. In reality, there is no conflict between human progress and environmental sustainability; well-being is directly and positively connected with a healthy environment.
Many other factors that are not captured by GDP affect well-being. These include the distribution of wealth and income, the health of the global and regional ecosystems (including the climate), the quality of trust and social interactions at multiple scales, the value of parenting, household work and volunteer work. We therefore need to measure human progress by indicators other than just GDP and its growth rate.
![]() The decoupling delusion simply props up GDP growth as an outdated measure of well-being. Instead, we need to recouple the goals of human progress and a healthy environment for a sustainable future.
The decoupling delusion simply props up GDP growth as an outdated measure of well-being. Instead, we need to recouple the goals of human progress and a healthy environment for a sustainable future.
James Ward, Lecturer in Water & Environmental Engineering, University of South Australia; Keri Chiveralls, Discipine Leader Permaculture Design and Sustainability, CQUniversity Australia; Lorenzo Fioramonti, Full Professor of Political Economy, University of Pretoria; Paul Sutton, Professor Department of Geography and the Environment, University of Denver, and Robert Costanza, Professor and Chair in Public Policy at Crawford School of Public Policy, Australian National University
This article was originally published on The Conversation. Read the original article.
Ku-ring-gai’s BioBanking Policy
Ku-ring-gai Council is anticipating that there will be a strong demand for biodiversity offsets once biodiversity legislation comes into operation in August. At the council meeting on 13 June a decision will be made whether to support the adoption of the Biodiversity Banking and Offsets Scheme (BioBanking) as an ongoing biodiversity management approach within council owned or managed land classified as Community Land under the Local Government Act 1993. Public consultation to assess the community’s acceptance of the ongoing creation of BioBanking sites will take place before the scheme is finalised.
So far there is one BioBanking site at Rofe Park, Sheldon Forest and Comenarra Creek Reserve and a decision has been made for another site yet to be determined in respect of land clearing by the North Connex project. Ongoing BioBanking within council-owned or managed land will strengthen the protection of biodiversity values and increase the funds available for management activities which improve biodiversity conservation.
As pointed out in the council meeting papers and in the article about offsetting on changes under the Biodiversity Conservation Act 2016, the impacts of development within Ku-ring-gai could be offset elsewhere in NSW. This could be circumvented if offset lands are made available.
Also the new system is weaker in its requirements for like-for-like offset requirements. Plant Community Types (PCTs) which don’t exist within Ku-ring-gai could in some circumstances be offset with different PCTs occurring within Ku-ring-gai, creating further offsetting opportunities.
The selection of potential BioBanking sites in Ku-ring-gai will seek:
- to maximise landscape connectivity;
- to protect sites of high ecological value and resilience, as directed by council’s 2015–17 bushland prioritisation matrix; and
- to align with regional conservation priorities, including the Office of Environment and Heritage’s Biodiversity Investment Opportunities Map – this map identifies areas for investment within the Cumberland subregion, which include either core areas or biodiversity corridors of state or regional significance.
If you are interested in obtaining further information look out for developments on council’s website.
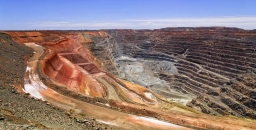
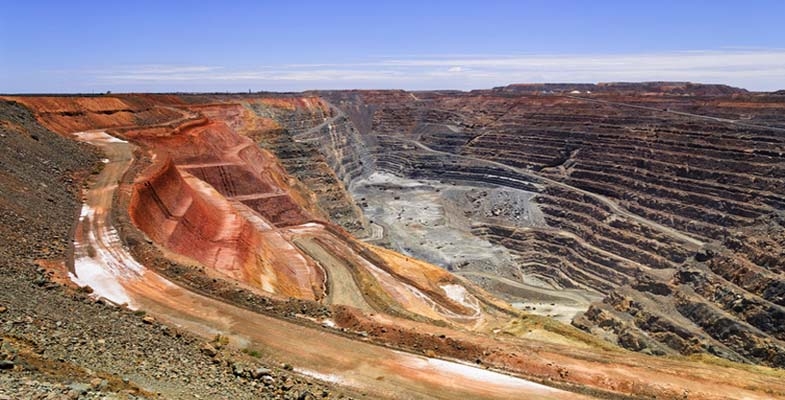
Adani Coal Mine – Surely it Can’t Go Ahead
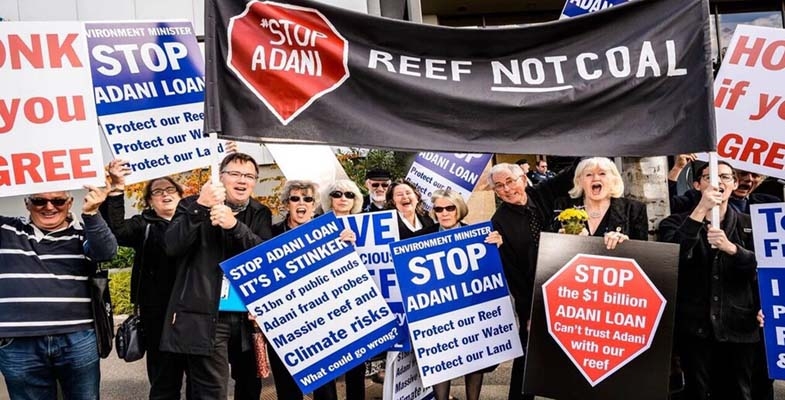
The Australian and Queensland governments are still pushing for the Adani mine to go ahead and are bending over backwards to make this possible. The local native title holders are opposed but the Australian government is trying to legislate away the aboriginal rights.
We still haven’t heard if the Northern Australia Investment Facility will provide a concessional loan of $1 billion to finance the rail line from the Carmichael Basin to the port at Abbot Point on the Great Barrier Reef.
Queensland has offered financial inducements such as the deferral of royalty payments and no payment will be required for the mega litres of water that will be drained from the Great Artesian Basin. Local farmers are concerned about the effect on their water supplies.
Adani has announced a decision to go ahead in principle. But where will the finance come from when already 16 major banks have declined to participate? They can see that the project is not viable. When will reality hit the politicians?
There are many reasons why the mine will be a disaster:
- Adani has a dubious record that is hard to pin down due to complicated corporate structures and use of offshore tax havens.
- The chief benefit being promoted is jobs, jobs, jobs but realistic figures are for only about 1,500 full-time equivalent direct and indirect jobs as against the hype of 10,000 jobs.
- The Minister for Resources and Northern Australia, Matt Canavan, claims that the coal will bring the Indian peasants out of poverty. But solar energy has been shown to be more affordable.
- The mine is a total environmental folly. The opening of the Adani mine and construction of the railway line will open up the whole Galilee Basin that contains enough coal which, if burned, could blow away any hope of keeping global warming within 2°C and undermine any national and state action to tackle climate change.
- The mine threatens the Great Barrier Reef not only because of the increase in sea temperatures from climate change. The recent heavy rains led to coal washing into wetlands next to Abbot Point, the coal loader leased to Adani. Is this an example of worse to come?
- The mine would harm the economy of other coal mining states. The massive increase in production would reduce the coal price for coal mined in the Hunter Valley.
- The current rapid move to renewable energy is likely to reduce demand for coal to the extent that the coal market will collapse. The governments’ support could well be wasted.
Rodent Eradication on Lord Howe Island – A Case Study of Cost Benefit Analysis

Lord Howe Island is a magnificent island about 600 km off the coast of NSW. Its unique landform as an eroded volcanic peak and endemic biodiversity led to its classification as a World Heritage site. The southern end is dominated by the basalt peaks of Mt Gower (875 m) and Mt Lidgbird (777 m) covered in dense forests. The northern end is undulating and partially cleared for settlement. Lord Howe’s crescent shape embraces a sheltered lagoon and the southernmost coral reef on the planet.
The number of residents and visitors is limited by its small size and mountainous topography. Its economy depends on tourism and propagation and export of the kentia palm. The maximum number of tourists on the Island at any one time is constrained to 400 and the number of residents is about 350.
When I last visited the island in 2002 there was talk of a project to eradicate rodents. Rats and mice arrived in 1918 as escapees from a grounded ship. Rodents have contributed to the extinction of a number of species and are recognised as a threat to at least 13 bird species, 2 reptiles, 51 plant species, 12 vegetation communities and numerous threatened invertebrates.
The problem is that there is no native mammal species on the island that can compete with, or predate, on the rats and mice. Any impact on the natural values of the island diminishes tourism and recreation values since these are inextricably linked to the islands unique biodiversity and World Heritage values. (Attempts have been made to bring in other predators that are another example of the problems humans can cause when we interfere with nature – see the end of this article.)
Predation by rodents on kentia palm production reduces values associated with this commercial activity, via reduced production and added costs. In addition, rodents impose costs to residents and tourism operators via the need to bait to reduce visual presence of rodents, the spoiling of food stuffs and potentially health impacts to residents and tourists alike.
There has been a long process of investigation and consultation with concerned residents and I understand that the issues are still not resolved. The main problem is the acceptance of widespread use of poison baits. It is hoped that final approval will be granted later this year. The ABC Radio National Off Track program had two episodes on Lord Howe Island’s ecology during early June including discussion of the project and the damage being done by rats.
I recently discovered one of the reports on the project. The Economic Evaluation of the Lord Howe Island Rodent Eradication Project prepared by Gillespie Economics (November 2016). It is an interesting example of cost benefit analysis, the sort of analysis expected by government. As expected with an economic evaluation the report covers the financial aspects of the project. But it is also tries to quantify other community and environmental effects that cannot be directly related to money using some of the techniques of environmental economics.
Cost Benefit Analysis
Cost benefit analysis (CBA) provides a comparison of the additional costs and benefits with the rodent eradication project (REP), relative to without the REP. Provided the present value of additional benefits exceed the present value of additional costs, a project is considered to improve the wellbeing of society and hence is desirable from an economist’s point of view.
The net present value of a benefit or cost arising in the future takes into account the value of time through the process of discounting. The discount rate is a huge area of controversy. Business and government usually use commercial interest rates while society may consider a much lower rate is appropriate so that the interests of future generations are not discounted using the questionable theory that they will be better off than current generations.
A prime example is the issue of climate change – some argue that the costs borne in transitioning to renewable energy sources now do not justify the benefits of avoiding the loss of crops, bushfires, heat stress, sea level rise 50 or 100 years hence. If the benefits of avoiding costs in the long term are discounted at commonly used interest rates then the costs of transition today may exceed these benefits. Part of the problem is the broad assumptions needed to value loss of biodiversity and other environmental assets. The REP project analysis provides some examples of surrogate methods that are used. I will leave the reader to decide on the validity of the methods.
Scope of the REP
The Lord Howe Island Board currently implements a limited rodent control program at a cost of $85,000 per year. However, it is not reducing the rodent population sufficiently to limit landscape scale ecological impacts and there is a risk that continuation of the current approach will result in bait shyness and/or resistance in the rodent population.
The Lord Howe Island REP will use cereal baits laced with the anticoagulant Brodifacoum dispersed from helicopters in the uninhabited areas, and a combination of hand broadcasting, bait stations and bait trays in the settled area. Preparation is required to ensure some species are not killed by the baits. The iconic woodhens that were rescued from extinction and the local currarongs will have to be captured and caged for the period the baits are potent.
Without the REP, the current rodent control program would continue but this can only cover accessible areas of the island. The rodents have plenty of food sources all over the island. There would be continued presence of poison in the environment, continued impacts on the kentia palm and nursery industry, further degradation of World Heritage values (including endemic and threatened species) and the potential for Lord Howe Island to be inscribed on the List of World Heritage in Danger.
Cost Benefit Analysis Results
The analysis calculates that the present value of costs of the project and follow up management including measures to return species that are currently extinct from the island over 30 years is $9 million. By contrast the value of the benefits is $150 million. Hence this analysis shows that the economic value of the project is obvious.
Just looking at the cost of the project compared with ongoing costs of the current methods of control the net cost is about $8 million. Funding commitments have already been received from the NSW and Australian governments.
The removal of the effects of rodents on the kentia palm industry and vegetable production is valued at $1 million.
Some of the valuing of the benefits would be subject of much debate, for example:
- The improvement in biodiversity is deemed to increase visitor numbers. In warmer months when accommodation is already fully booked, increased demand is assumed to increase prices by 35%. In cooler months the accommodation demand is assumed to increase by 20% and prices by 7%. All this is assumed to have a present value over 30 years of $80 million.
- It is estimated that seven future extinctions will be avoided. The value of extinction prevention is based on several studies of community willingness to pay for the protection and recovery of threatened species. On an Australia-wide measure of community willingness to pay they are valued at $8 million each adjusted for a chance that the REP makes no difference to the chance of extinction to give a total of $40 million.
- There are also four species that are locally extinct, the Kermadec petrel, the white-bellied storm petrel, phasmid (stick insect) and wood-feeding cockroach. The return of these species is valued similarly with a deduction for the possibility of failure to reestablish the species at $27 million. One wonders if the general public would value the return of a species population by a transfer from another island in the same way as prevention of extinction of the only population of a species.
Even though some of these figures are debatable it is clear that the REP is worthwhile from an economic point of view. It is hoped that the local residents can be convinced of the benefits.
 A Further Complication – the Masked Owl
Not long after rats became a problem the authorities thought it was a good idea to introduce various owl species to control the rats. There is still a large population of Tasmanian Marked Owls. After the REP is completed their major food source will have disappeared so it is likely they will turn to other species. We don’t want more extinctions so a removal program will be required of these Masked Owls.
City Populations

There has been much media interest in the report that Sydney's population has reached 5 million. What has also been reported is that Melbourne’s population is growing faster than Sydney’s and may soon exceed it.
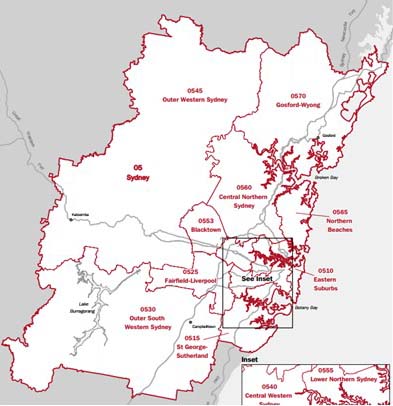
Sydney
The problem I have with this is that Sydney includes the Central Coast and the Blue Mountains, but not Wollongong. I don't advocate including Wollongong but leaving out the other two plus the Wollondilly Shire (Picton) we have 5.25 – 0.33 – 0.08 – 0.05 = 4.79 million. We could go further and leave out the farther reaches of Hornsby, Baulkham Hills and other local government areas.
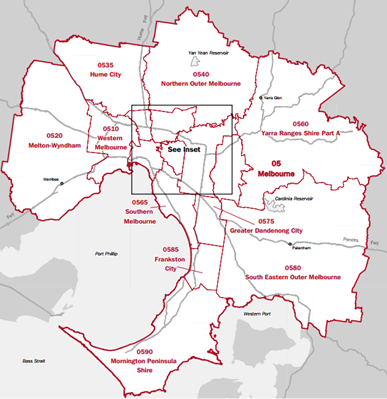
Melbourne
Melbourne includes the Mornington Peninsular (0.16 million) which is debatable. Other areas should also be removed (allow 0.05 million). So, 4.67 – 0.16 – 0.05 = 4.46 million which is 93% of Sydney’s population.
Distortions
Part of the problem for the Australian Bureau of Statistics is that the outer suburban local government areas cover large areas of peripheral rural land. The Sydney map at a guess is at least 75% rural and this leads to massive distortions when people try to compare densities.
This data below (from Population Australia) is rubbish. Population Australia is a website specialising in research for Australia population growth trends and estimation. It is not clear who is behind this group but the data seems to be coming from the Australian Bureau of Statistics.
More on this some other time.
Position | City | Population density |
1 | Melbourne | 453/km2 |
2 | Adelaide | 404.205/km2 |
3 | Sydney | 400/km2 |
4 | Perth | 317.736/km2 |
5 | Canberra | 173.3/km² |
6 | Brisbane | 145/km2 |
7 | Hobart | 124.8/km2 |
8 | Darwin | 44.976/km2 |
Jim Wells has been delving into published statistics that are more than meets to eye.
Threatened Species Children’s Art Competition
STEP is supporting a great initiative by organised by Forestmedia, a small not-for-profit organisation that is aiming to increase community awareness of the plight of our threatened species and help to develop the next generation of environmental leaders. The children’s art competition is supported by a number of organisations including the National Parks Association, the Nature Conservation Council, WIRES, Featherdale Wildlife Park, Humane Society International, Animals Australia and Taronga Zoo.
The competition is open from 5 June to 4 August to all primary aged children in NSW and the ACT. Fifty finalists’ works will hang in a two week exhibition in September at the Botanic Gardens and Surry Hills Community Centre, with winners announced on 7 September, Threatened Species Day.
There will be prizes in several categories. STEP is sponsoring a prize for a nocturnal animal artwork. Last year’s prize winners are shown on the website. They are very impressive.
Biodiversity Legislation Submission – Major Points for Comment Relating to Urban Areas

In May the NSW government released regulations and codes that provide some of the detail on how the biodiversity legislation will operate in practice. But it is not complete so there is still a lot of uncertainty. The call for submissions is an opportunity to express a view on what should be in the areas that are missing as well as the available drafts.
There is a large volume of information to digest. The most useful one is the Submission Guide: Ecological Sustainable Development.
Consistent with STEP’s interests we focus on the aspects that relate to the management and preservation of urban bushland. Refer to our article on the issues regarding the Biodiversity Offsets Scheme.
The major areas that are missing are the Vegetation State Environment Planning Policy (Vegetation SEPP) and some of the maps that will underpin the decision-making process. This is most unsatisfactory! The legislation is due to come into force on 25 August. It is an abuse of due process to be conducting consultation on incomplete information.
The Vegetation SEPP will regulate clearing of vegetation in urban areas and environmental conservation/management zones where clearing does not otherwise require development consent under the main planning act, the Environmental Planning and Assessment Act. So the zones that are covered include E2, E3 and E4 zones.
The major concern is the inclusion of E2 zones in the clearing provisions. This zone is for areas with high ecological, scientific, cultural or aesthetic values outside national parks and nature reserves. The zone provides the highest level of protection, management and restoration for such lands whilst allowing uses compatible with those values.
E3 (environmental management) and E4 (environmental living) zones accommodate low-impact residential development but contain, or are near, bushland so have particular environmental or risk factors.
So why is the Vegetation SEPP regulating clearing on E-zone land, in particular E2 land? Clearing should not be allowed except for bushfire safety and other protection reasons.
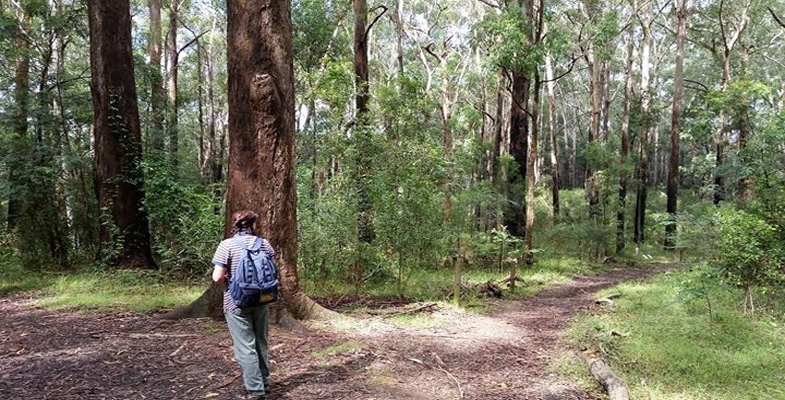
Examples of land that could come under the new regulations are near the Blue Gum High Forest area in Dalrymple Hay Reserve and the area between Berowra Heights and Cowan near the Great North Walk. Most people assume the latter is national park but much of the natural scenery enjoyed by walkers is zoned E2, E3 and even RE1 (public recreation) and would have little protection under the proposed SEPP. Some E2 land is protected by being a BioBanking site or part of a conservation agreement, but not all.
Sensitive Biodiversity Values Land
There are certain areas, regardless of land area, that will require a biodiversity assessment (and offsetting if clearing is approved) if they are mapped in a Sensitive Biodiversity Values Lands map. The definition of areas included is very restricted.
Comment for submissions
The final map is not available and we understand many parts of NSW have not been properly assessed yet.
The resolution of the draft map on the website is too low to identify particular sites.
Areas that don’t meet the definition and should be included are endangered ecological communities (e.g. Sydney Turpentine Ironbark Forest and Duffys Forest EECs), buffer zones around EECs and areas of critical habitat, e.g. Ku-ring-gai Flying Fox Reserve.
Will it be possible to nominate areas for inclusion? Local land managers should be able to have a say on what is Sensitive Biodiversity Values Land.
There is a real danger that clearing of EECs such as STIF could rapidly turn it into critically endangered. A council’s discretionary DCP would be the only protection. It takes some time for a change in classification of vegetation communities to be finalised. In the meantime will they be cleared beyond hope of recovery?
Clearing Provisions
The clearing provisions are determined by categories of development.
Development consent required
Development consent is required (under the Environmental Planning and Assessment Act) for larger developments and infrastructure.
The Biodiversity Assessment Method (BAM) applies to clearing and the flawed offset provisions will apply.
Development consent NOT required
When development consent is NOT required, e.g. clearing of undeveloped land, the Biodiversity Offset Scheme (BOS) thresholds apply as prescribed below:
Minimum lot size | Proposed area of clearing |
Less than 1 ha (10,000 m2) | 2,500 m2 or more |
Less than 2 ha | 5,000 m2 or more |
2 to 39 ha | 5,000 m2 or more |
The thresholds are high.
For clearing above the threshold the BOS applies and approval will be determined by the Native Vegetation Panel. A biodiversity offset obligation will be imposed. Local councils could be given authority to do this assessment. We don’t know who will be appointed to the Native Vegetation Panel.
Clearing below the threshold will be regulated under the local council’s Development Control Plan (DCP) through a permit system. This will be the most likely situation in urban areas,
There is currently wide variation in the standards of DCPs, for example in relation to individual trees. Ku-ring-gai requires a permit for clearing of most native trees and vegetation and non-native trees while Hornsby only controls clearing of locally endemic native trees or trees in heritage zones. It is possible that the government will impose standard clauses in DCPs. Indeed would these be desirable if a high standard is applied?
Comment for submissions
It is essential that the objectives of clause 5.9 of the standard LEP are carried over to DCPs under the new scheme that is ‘to preserve the amenity of the area, including biodiversity values, through the preservation of trees and other vegetation’.
Submissions should explain desirable standards for the DCP regulations. One area that has not been covered is how the DCP clearing codes will fit in with the need for wildlife corridors and the Greater Sydney Commission’s guidelines for the Green Grid and minimum tree canopy cover.
Other Impacts of Clearing Regulations
A major issue with the local regulation of clearing is that there will be no monitoring of loss of vegetation communities and assessment of cumulative impacts. There needs to be a database of regional clearing approvals.
There is uncertainty about the legal status of DCP regulations and the ability to prosecute if breaches occur.
Areas of western Sydney that will be subject to the greatest amount of new development need as much protection as possible of native vegetation and habitat. The Cumberland Plain Woodland has already had large areas cleared. The allowable clearing and the use of offsets under the proposed regulations will further reduce the area of remaining native vegetation and habitat.
Conclusion
Given the limited areas of bushland in urban areas, it is inevitable that there will be more losses of irreplaceable biodiversity. The offsets provisions do not adequately factor in the scarcity of suitable offsets in urban areas (see article below). The rules must be amended to ensure maximum protection of native vegetation in urban and E zones, particularly areas containing threatened species.
Please Send a Submission
Closing date: Wednesday 21 June. Lodge online or post to Land Management and Biodiversity Conservation Reforms, Office of Environment and Heritage, PO Box A290, Sydney South, NSW 1232.
Assessment of Biodiversity Offsetting – A Fail and Worse to Come

Over the past 200 years NSW has lost almost half of its bushland through land clearing and only 9% of what is left is in good condition. Clearing of native vegetation and habitat modification are the greatest threats to the survival of the majority of species on the threatened list.
The biodiversity laws that the government passed in late-2016 place a great deal of emphasis on offsetting as a means of allowing development to occur. The theory is that biodiversity lost when clearing for a development can be replaced by providing for restoration or protection of biodiversity in another place.
The Nature Conservation Council recently published a report on the operation of NSW’s biodiversity offset schemes, called Paradise Lost: The Weakening and Widening of NSW Biodiversity Offsetting Schemes, 2005–16. This article outlines the key findings of the report.
As you can tell from the title, the principles of offsetting have been severely compromised. We can expect worse to come under the new laws.
Concept of Biodiversity Offsetting
Biodiversity offsetting has been in use in NSW since 2005 under various pieces of legislation.
One example is the money that was paid by NSW Transport Infrastructure Development Corporation to compensate for the loss of 0.33 ha of Blue Gum High Forest when the railway station at Hornsby was expanded. The money was used to help purchase land to expand the area of protection of Blue Gum High Forest next to Dalrymple-Hay Nature Reserve.
The basic principles that should be observed are given below.
Offsets hierarchy
Offsets should only be used after appropriate avoidance and minimisation measures have been taken according to the mitigation hierarchy. A biodiversity offset is a commitment to compensate for significant residual adverse impacts.
No net loss
A biodiversity offset should be designed and implemented to achieve measurable conservation outcomes that can reasonably be expected to result in no net loss and preferably a net gain of biodiversity.
Some areas should be off limits – red flags
There are situations where residual impacts cannot be fully compensated for by a biodiversity offset because of the irreplaceability or vulnerability of the biodiversity affected.
Consider whether restoration is possible
Biodiversity offsetting assumes ecosystems and habitats can be re-created. This is often not the case, particularly if offset sites have been highly degraded and lost essential characteristics. In Australia, a number of studies have shown revegetated areas rarely resemble the ecosystem it was intended they would replicate.
Timing mismatch
It takes some time for species to establish a viable population in a new habitat. Offsetting should allow for a phased-in approach to prevent the total loss of species that are already threatened. The loss of hollow-bearing trees is a particular example.
Stakeholder participation
In areas affected by the project and by the biodiversity offset, the effective participation of stakeholders should be ensured in decision-making about biodiversity offsets. All stages including their evaluation, selection, design, implementation, monitoring and communication of results to the public should be undertaken in a transparent and timely manner.
Long-term management
The design and implementation of a biodiversity offset should be based on an adaptive management approach, incorporating monitoring and evaluation, with the objective of securing outcomes that last in perpetuity.
Case Studies
There are five types of offsets schemes operating in NSW. The performance of each of these schemes was examined through the lens of eight case studies:
- Namoi catchment property vegetation management plans – approval for land clearing under the Native Vegetation Act
- Kellyville in northwest Sydney – creation of credits under the BioBanking scheme
- Wagga Wagga local environment plan – biodiversity certification for strategic planning
- Albury local environment plan – biodiversity certification for strategic planning
- Huntlee development in Hunter Valley – Office of Environment and Heritage principles for biodiversity offsetting
- Boggabri and Maules Creek coal mines – development consent – Office of Environment and Heritage principles for biodiversity offsetting
- Warkworth mine extension – Office of Environment and Heritage principles for biodiversity offsetting
- Mt Owen mine expansion – NSW biodiversity offsets policy for major projects
The report provides a detailed description of the features of each case study and compares them with the expected standards. The criteria for the analysis were:
- be a last resort after avoidance and mitigation (including appropriate ‘red flags’)
- deliver biodiversity equivalence (like-for-like)
- provide security and achieve benefits in perpetuity
- deliver a net gain in biodiversity
- be additional to conservation measures already in place
- be enforceable, resourced and well-managed
- be subject to a rigorous monitoring and evaluation framework
- be open and transparent
It was demonstrated that biodiversity offsetting is failing to deliver the environmental outcomes promised. No case studies resulted in outcomes deemed ‘good’ and the outcomes were:
- ‘disastrous’ in one study (Boggabri/Maules Creek)
- ‘poor’ in five studies (Warkworth, Mount Owen, Huntlee, Albury, Kellyville)
- ‘adequate’ in two studies (Namoi, Wagga Wagga)
For more details read the report.
Comparison of Offset Schemes
The report considers that a scheme should have the following features:
- excludes discounting of offset credits
- excludes supplementary measures
- excludes mine rehabilitation
- clear standard for environmental outcomes
- does not allow payment in lieu of offsets
- red flags
- impacts on water quality and soil are taken into account
- like-for-like offsetting
The case studies demonstrate the features of the five biodiversity offset schemes in operation. It was found that the later models contained fewer best-practice principles and standards than the earlier ones:
- only the first offsets scheme (the Environmental Outcomes Assessment Methodology under the Native Vegetation Act) contained all eight features
- the Biodiversity Offsets Policy for Major Projects introduced by the Baird government in 2014 contained only one of the eight features
Overall, biodiversity offsetting schemes have failed to deliver the promised outcomes and they have become weaker as standards have slipped.
Draft Biodiversity Offset Scheme is Even Worse
The latest Draft Biodiversity Offset Scheme (BOS) and the Biodiversity Assessment Methodology (BAM) that will be used to determine offsetting does not include any of the features described above.
The BAM is a metric-based tool that allows biodiversity impacts and improvements to be assessed and quantified in terms of ecosystem credits and species credits, collectively known as biodiversity credits that will need to be offset.
The proponent can choose to between three methods of meeting their offset obligation:
- buying credits for a suitable site under the offset rules from the market, or they can establish a Biodiversity Stewardship Agreement on their own land and retire the credits generated
- make a payment to the Biodiversity Conservation Trust that will source the offsets
- paying for conservation actions as approved by the consent authority
Key points for submissions
The key points on the features that should be in the offsetting legislation and the changes that are needed are listed below.
1. Discounting of biodiversity credits should not be permitted
The government proposes introducing ‘discounting’ that will allow offset credit requirements to be ‘discounted’ based on claimed social and economic benefits. Economic prioritisation policies are likely to contribute to the incremental and permanent loss of significant biodiversity in NSW, and undermine the credibility of the policy.
2. Supplementary measures should not be included
The BOS allows the use of ‘biodiversity conservation actions’ that may include research or surveys into the biodiversity under threat. This is not a genuine offset. The Scientific Committee stated in a report on this idea that this:
… is clearly a case of developers being able to buy themselves out of any obligation to protect biodiversity in any meaningful way.
NSW Scientific Committee (2014) Submission on the Draft NSW Biodiversity Offsets Policy for Major Projects
3. Allowance of mine rehabilitation
Numerous critics have questioned whether degraded mine sites can be effectively restored and in any case mine site rehabilitation should be an obligation of the mining company. Recently, developers have been permitted to use mine rehabilitation sites to generate biodiversity offset credits. The government proposes continuing this practice under the draft BOS.
4. Clear standards
The Biodiversity Conservation Act requires that the biodiversity assessment method should adopt a standard that result in no net loss but the draft BAM does not have a clear objective to protect biodiversity.
5. No payment in lieu
The draft BOS would allow proponents to discharge offset requirements simply by paying money into Biodiversity Conservation Trust. The development could proceed without certainty that the required offset is possible.
6. Red flags
The BOS does include some restrictions on proposals that cause ‘serious and irreversible impacts’ (SAII) but the criteria for defining SAII are too weak. It includes only the most endangered and restricted area species and ecological communities. In the case of major projects the SAII risks can be ignored. The net effect will be that EECs and endangered species not listed in the list of SAIIs, e.g. STIF and Duffys Forest, could be cleared without offset requirements if the land area is below the clearing thresholds. A council’s discretionary DCP would be the only protection.
7. Other impacts on water and soil
Other impacts should be considered in the BAM. The assessment methodology covers only a limited range of biodiversity values such as vegetation integrity and habitat suitability but not soil health and water quality and availability.
8. Like-for-like principle
The like-for-like principle that offsets should replace the values being lost is undermined in several aspects. For example:
- Offsets can be found from a radius of 100 km. It will be easier and cheaper to find offsets outside urban areas undermining preservation of biodiversity and threatened species and EECs such as STIF. The loss of existing geographic distribution if sites in urban areas are lost will undermine species resilience and long term adaptation to climate change.
- Offsets can be used for species across similar vegetation classes or between species. This even applies to threatened species; a koala can be swapped for a wallaby.
Conclusion
The government is proceeding with this model despite warnings expressed by leading scientists, lawyers and conservationists. The government basically has ignored the advice of the experts because it is wants to deliver development at any cost. Implementing the BOS will in fact add extinction pressures to the very species and ecological communities it is supposed to protect by facilitating the more rapid and widespread destruction of threatened species habitat across NSW.
Please Send a Submission
Closing date: Wednesday 21 June. Lodge online or post to Land Management and Biodiversity Conservation Reforms, Office of Environment and Heritage, PO Box A290, Sydney South, NSW 1232.