
Newsletter blog
Children categories
Development of Crimson Hill, the Old UTS Site
Firstly, some history; in 2003 UTS decided to vacate the site and sought a rezoning for residential development with 560 buildings. Ku-ring-gai Council refused the application so the state government intervened and declared the site to be a Part 3A project under the EPAA Act. The Minister for Planning became the decision maker.
STEP was a member of a community consultative committee established to demonstrate that the community had been consulted. The committee opposed many aspects of the development plan. There were some wins in the transfer of 9 ha of the land to management by Lane Cove National Park and some improvements including a reduction in the number of dwellings approved for the site, the retention of a full-sized oval for community use and the retention of heritage buildings.
Of course there are no additional funds available to the NPWS to manage the additional national park land. A significant area of bushland has been modified to establish the asset protection zone and of course there will always be traffic and parking problems especially when the new school is operating. The management of stormwater and the risk of weed encroachment will need to be closely monitored.
Crimson Hill – Defence Housing Australia (DHA)
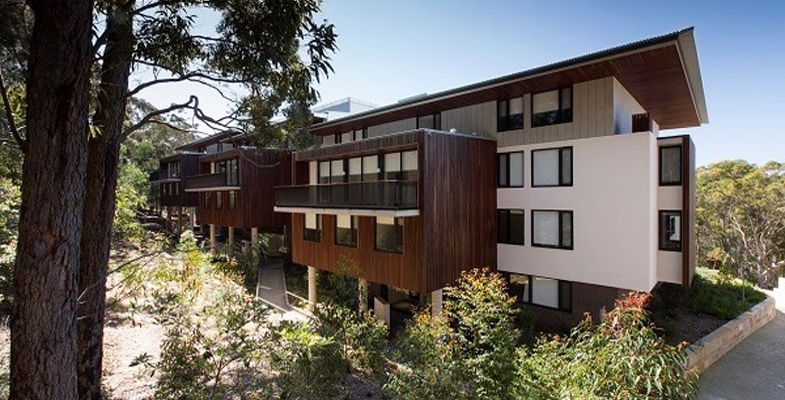
Crimson Hill estate was designed along simple, environmentally sound principles aimed to establish a new integrated community connected by bushland trails and elevated walkways. The objective was to promote community interaction and well-being. It has 345 dwellings occupying a portion of the 12.6 hectare site of rezoned land that DHA purchased from UTS in March 2011.
A significant area of this land, including publicly accessible bushland and nature trails for bushfire management, is in the care of the new residents via a Community Management Association.
It is DHA’s first multi-residential housing project and is being constructed in five phases. The name is a salute to the colour of the ribbon on the Victoria Cross medal. Each residential precinct is named after one of the five recipients of the VCs awarded for bravery on a single day during the battle of Lone Pine in 1915:
- Burton’s Place – Alexander Stewart Burton
- Dunstan Grove – William Dunstan
- Tubb’s View – Frederick Harold Tubb
- Hamilton’s Corner – John Hamilton
- Shout Ridge – Alfred Shout
The estimated 700 residents, expected to occupy Crimson Hill eventually, comprise a mix of Defence personnel and civilians. There are many owner-occupiers and tenants.
DHA is an Australian government enterprise established by the Defence Housing Act 1987 to supply housing and related services to Australian Defence Force members, in-line with operational requirements. Launched in 1988 as a statutory authority, DHA is now a commercially-funded organisation that has projects all over Australia. During 2015–16, DHA managed 18,767 properties for ADF members and civilians.
Before construction commenced in 2013, the brownfield site had significant areas of native remnant bushland around the university campus. A detailed ecological assessment was done before any clearing started.
Indigenous seeds were collected from endemic species and these were replanted. It is estimated that over 90% of plants on the site now are native and the majority are locally occurring species.
The centrepiece of the estate is Charles Bean Sports Field, opened in December 2013. It was developed by DHA with Ku-ring-gai Council and the Northern Suburbs Football Association. The purpose-built, publicly-accessible sports field has received FIFA 2-star certification, the highest accreditation an artificial grass field can receive. There are football teams coming and going continually and it is rare to see the field without players on the evergreen surface.
Rainwater is harvested within the buildings for re-use and some have solar panels to reduce main-grid energy usage. Environmental consultancy Cundall, estimates the buildings will use 60% less energy and water than standard multi-residential developments. The residential development was designed by two architectural companies: Bates Smart and Architectus. Construction was by two building companies: Grindley and Ganellen.
The recently finished Shout Ridge is the first apartment building in Australia to receive a prestigious 6-Star Green Star – Multi Unit Residential Design V1 certified rating for environmentally sustainable design from the Green Building Council.
New School on the Horizon
The latest good news for Lindfield residents is that planning is underway for a major refurbishment of the empty UTS building that remains from its previous use as a university. The building is earmarked to become a new K to 12 school.
The large concrete building was handed over to the NSW Education Department as part of a land swap with UTS. Eventually 2,000 primary and secondary students are anticipated to attend the new school. It hopes to have high quality technical spaces for science, engineering, hospitality, visual and performing arts, as well as music and film. And there will be a childcare facility.
The former UTS building has architecturally heritage because it won the prestigious Sulman Medal for architecture in 1978. This is the highest award given in Australian architecture.
New Walking Track
NPWS and DHA, with the assistance of Friends of Lane Cove National Park, are building a new track from Crimson Hill to Lane Cove National Park. Locals will be able to walk along this bushland track and stroll among wonderful angophora, wattle and eucalypt trees to get down easily to Lane Cove National Park all without any need to get into a car. At a construction cost of more than $220,000, the track will be one more amenity for the residents of Crimson Hill and other locals.
Note: As it is, the track is not shown on our new map, Walking Tracks of the Lane Cove Valley. An example of how hard it is to keep up-to-date.
Lots More Development
As President of the Friends of Lane Cove National Park, Tony Butteriss points out in Regenavitis, wherever you look in Sydney now, there is more development and if feels as if it is getting closer to Lane Cove National Park. There are numerous projects coming right on the edge of the Park including the old UTS site, old Screen Australia site (adjacent) and redevelopment of the Acoustic Laboratory. However, the development that makes all the others look as if they are only playing, is the one at the Epping Road end of Delhi Road. Strictly speaking it is not one but at least three different developments planned to have a total of more than 2,200 units. This will have an impact of (at least) 5,000 people.
This particular development is a worry but consider the cumulative effect of all of them. Each development reduces habitat surrounding the Park. Each brings more hard surfaces and increases the speed of run-off after storms. And each brings visitor overcrowding to the Park. What can local groups do about this? The Friends hope to persuade the developers to fund some restoration projects.
The February edition of Regenavitis, the newsletter of the Friends of Lane Cove National Park, included the following update on the development of the former UTS (Ku-ring-gai) site in Lindfield that is now called Crimson Hill. We thank them for permission to reprint.
Click here for more information on the campaign.
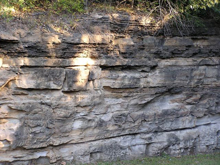
Thirlmere Lakes and East Coast Lows
Thirlmere Lakes lie in an area that was subject tectonically to weak uplift and gentle monoclinal warping at the ill-defined southern end of the Lapstone Structural Complex, a feature that is highlighted further north by the bold escarpments of the Lapstone Monocline and the Kurrajong Fault. The chain of five shallow, swampy lakes lies in the remnants of an alluvium-filled, mature, incised-meandering river system that ancestrally drained westwards into the Wollondilly catchment. However, as a consequence of the gentle upwarping plus relative subsidence of the adjoining Cumberland Basin, the drainage direction in the north-east sector of the chain has been reversed due to headwater capture by Cedar Creek, which flows via Stonequarry Creek south-eastwards to the Nepean. The lakes are essentially stranded on a gentle watershed between two drainage systems.
The catchment area of the lakes is relatively small, roughly 10 km2 of Hawkesbury Sandstone spurs and side-valleys, and there is no long distance drainage flow-through along the dismembered ancient river course. But they overlie a substantial thickness of water-saturated alluvium whose water leaks away very slowly, and are in one sense the surface manifestation of its rising and falling water table.
Rises and Falls in Water Level
Latter day fluctuations in the water levels in these ancient lakes have been the subject of much recent debate centred around the possible effects on aquifers of longwall coal mining in nearby Tahmoor Colliery, operated by Xstrata. Other suggested factors have been the pumping of aquifers for local agricultural purposes.
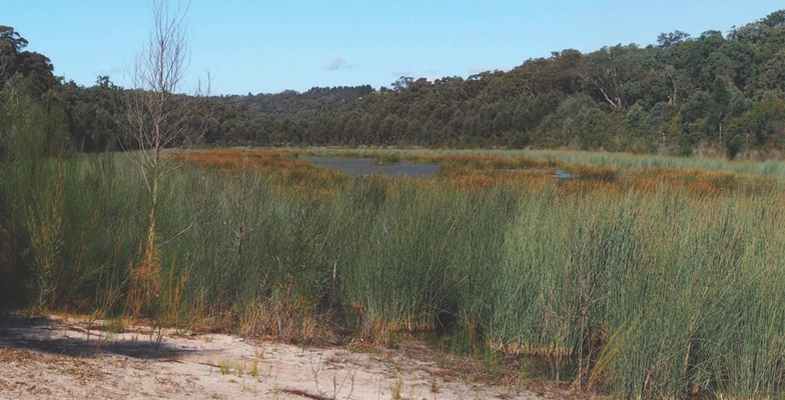
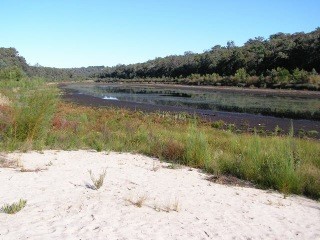
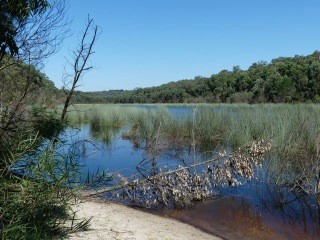
Levels were particularly low in June 2010 (photo bottom left) and then rose quite slowly – below many people’s expectations (photo at the top of the page was taken in May 2015). However, the lakes now (March 2017) are as full as they’ve been in recent decades (photo bottom right).
You can easily access the rainfall data of the Bureau of Meteorology’s automatic rain gauge located near Buxton 3 km to the south, and from it you can deduce some interesting correlations.
The low water levels of 2010 following the exceptionally dry year of 2009 (photo bottom left) occurred when only 588 mm was recorded against a mean of 856 mm. In strong contrast, in 2017 (photo bottom right) is a hangover from the massive east coast low falls of June 2016 when 387 mm was recorded at Buxton, including a one day fall of 188 mm (contrast the wettest monthly total for 2009 of only 97 mm). Rains from east coast lows can overwhelm everything over huge areas, create massive floods, and fill and sometimes overflow our storage reservoirs. The plants don't need all that extra water, especially in winter, and what doesn't run off will bypass their root systems and swell the aquifers, including those that feed the lakes.
And what of the gradual rise in lake levels from 2010 onwards that had many people puzzled? Well, four out of the six years from 2010 to 2016 brought above average rainfall, peaking at 971 mm in 2013, and the other two were only slightly below – 736 mm in 2011 and 841 mm in 2014. The maximum one day fall in that period was 133 mm in January 2013 and January and February of that year scored a combined total of 326 mm. This was thus a slightly wetter than average time and the photo at the top of the page shows Lake Werri Berri recovering, roughly half full, in May 2015, a year in which the preceding month of April was the wettest one with a total of 164 mm.
Are we still pointing a finger at Xstrata's longwall mine system? Well this is a personal opinion and don't quote me as an expert, but I believe it can only be a minor factor at most; rainfall versus evaporation is demonstrably the major control, as has been the case from historical records and one which is built into the conclusions of the report cited below. How climate change will affect things in the future is unknown, though there is already evidence of increasing intensity within rainfall events. More ones like June last year can only be good for the lakes.
Recommended reading: Thirlmere Lakes Inquiry Final Report of the Independent Committee, 23 October 2012
John Martyn recently visited Thirlmere Lakes to see how the area has fared during the recent period of freak weather. In STEP Matters 186 we wrote about concerns that the significant drop in water levels since the mid-1980s was due to longwall mining. It seems the picture has changed considerably.
Wianamatta Group
The name Wianamatta is familiar through the loose usage of the term ‘Wianamatta Shale’ to embrace the Triassic rocks that overlie the Hawkesbury Sandstone. This is an informal term, distinctly woolly in its definition, and should be avoided, but if it must be used, ‘shale’ or ‘shales’ should always be spelt lower-case.
Wianamatta Group, derived from the Aboriginal name for South Creek, was established formally in 1952, fully documented in 1954 and further revised in 1979. The group consists of three formations: the Ashfield Shale, Minchinbury Sandstone and Bringelly Shale. It occupies the centre of the Sydney Basin, lapping onto the lower Blue Mountains and extending southwards to the Southern Highlands. It has been defined largely from drillhole data because outcrop is mostly limited to road and railway cuttings and quarries.
The thickest stratigraphic section drilled was encountered in hole DM Razorback DH1 on
Mt Hercules near Picton. This passed through 304 m of Wianamatta Group strata consisting of 257 m of Bringelly Shale, 2 m of Minchinbury Sandstone and 45 m of Ashfield Shale.
The Ashfield Shale and Minchinbury Sandstone correlate well across much of the 50 km long area covered by the same Department of Mineral Resources drill program, whereas the Bringelly Shale is much less uniform, its variability enhanced by the presence of many scattered sandstone lenses of limited lateral extent but up to more than 40 m in thickness that are hard to correlate.
The Wianamatta Group was deposited on a coastal lowland subject to early minor marine incursions. The depositional environment evolved upwards into lagoonal or marshy lowland crossed by meandering rivers that brought surges of sand that filled channels and created the sandstone lenses.
Ashfield Shale
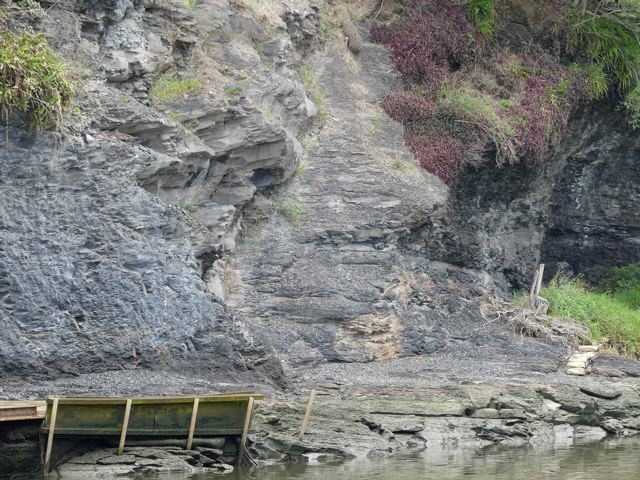
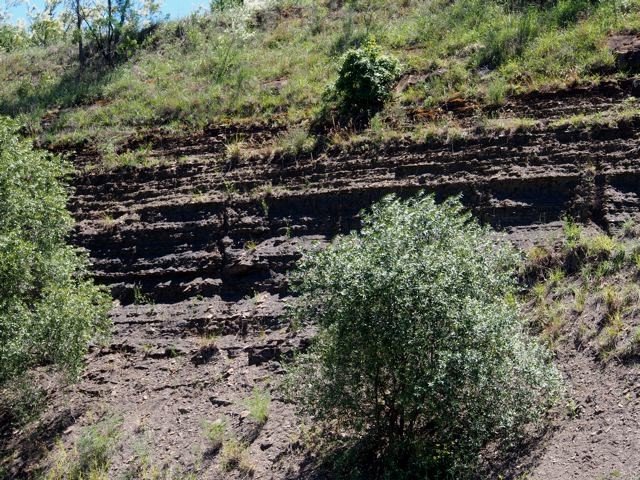
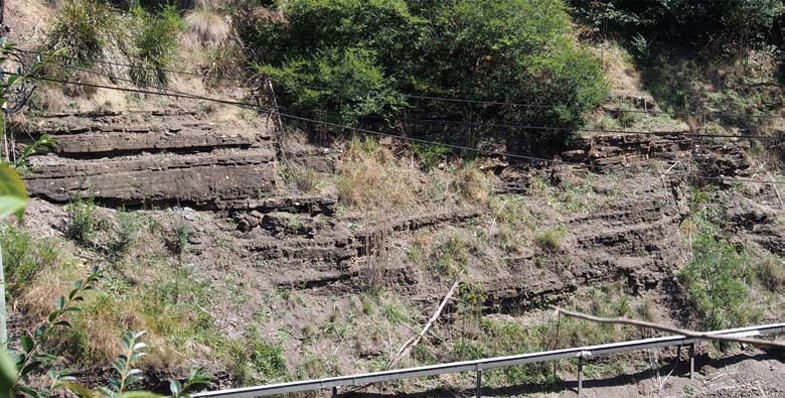
The Ashfield Shale has a maximum drilled thickness of 61.6 m at Erskine Park near the centre of the basin and has been subdivided into four members consisting of alternating layers of dark ferruginous shale and laminite.
All of these members were once incompletely exposed in the Thornleigh brick pit but this has since been filled in. Now, the most viewable Ashfield Shale faces can be found along the North Shore and Northern railway lines and Bells Line of Road, and in a number of other road cutting exposures such as Horace Street, St Ives and in the Picton–Campbelltown area.
The best natural exposure is the river-cliff in Mulgoa Nature Reserve south of Penrith which exhibits dark coloured Mulgoa Laminite Member, and also the river-cliff opposite the Parramatta ferry wharf (see photo). The Mulgoa cliff is visible from Mulgoa Road through gaps in a screen of riparian forest but is difficult to access on foot.
An important feature of the Ashfield Shale is its relatively high phosphorus content of between 0.1 and 0.9% P2O5. This is in strong contrast to the negligible amounts of phosphorus in the underlying Hawkesbury Sandstone and is also significantly higher than levels in the Bringelly Shale. Phosphorus values in Ashfield Shale measured from drill core tend to be spiky with prominent peaks, and it appears the element resides in thin beds rich in phosphatic siderite nodules.
Minchinbury Sandstone
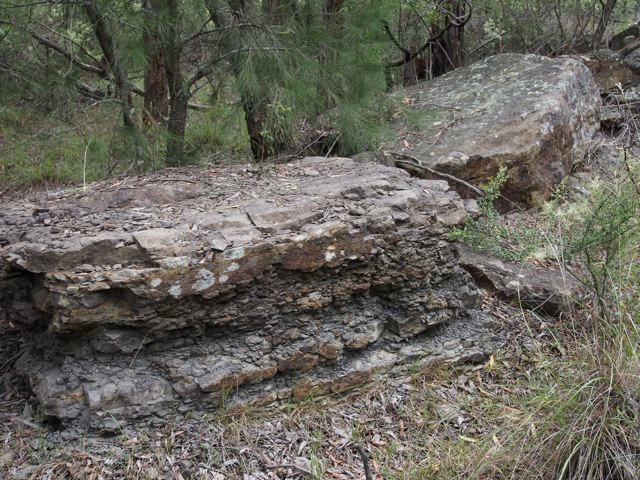
The Minchinbury Sandstone is a widespread but thin (less than 6 m) marker band of fine-grained, bluish-grey, brown-weathering rock that is rarely seen in surface outcrop and is known mainly from drill intersections. It is a quartz lithic sandstone with grains mostly of quartz with about 10% of rock grains. It also contains calcite, plus micas, notably muscovite which can be seen sparkling on broken surfaces. Another very similar, intermittent sandstone bed lies immediately above in the lower Bringelly Shale. Both sandstones weather deeply to a crumbly or flaky condition and surface expressions are subtle, or the sandstone outcrops are smoothed over by soil profiles or pasture.
Minchinbury Sandstone at Minchinbury is more than 100 m deep in a borehole, and finding its outcrops elsewhere, especially natural ones, is a challenge. Near the top of the Mulgoa shale cliff there is a thin (less than 1 m) band of very fine-grained flaggy sandstone which has been interpreted as Minchinbury. In Lansdowne Park (see photo) there is a train of large, disjointed sandstone slabs whilst other small outcrops and floaters are scattered along a low, hillside bench. There are a few others, but if you happen to know of any more, please let me know.
Bringelly Shale
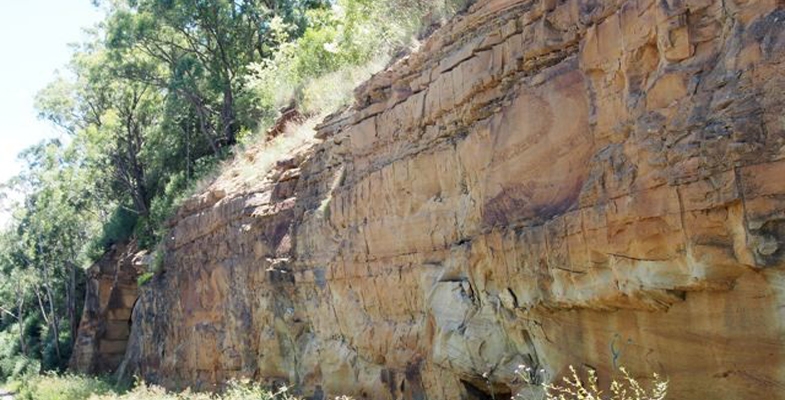
The Bringelly Shale is the uppermost formation of the Wianamatta Group and also the youngest Triassic sedimentary unit in the Sydney Basin. Reaching more than 250 m in the south, it is also one of the thickest.
The commonest rock type exposed is a mixture of finely-bedded shale, laminite and siltstone. Seen in road cuttings this differs from the dark, almost black, clay-mineral-rich Ashfield Shale, being more variable, often accompanied by disconnected sandstone lenses that become thicker and more prominent from Western Sydney Regional Park southwards, forming most of the hilly country between Campbelltown and Picton. Driving south or into the Picton area you can't miss them. They form intricate escarpments up to 200 m high, and the sandstone cliffs along the old Hume Highway near Picton (see photo) are of the two thickest ones, the Mt Hercules and Razorback Sandstone Members (see photo at the top of the page).
Such sandstones have been described as lenses and stacked multiple lenses and have been interpreted as infill deposits in channels created by rivers meandering across the swampy lowland. Their lateral extent is not great and they are difficult or impossible to correlate with one another across distances of more than a few kilometres, but they are important in defining the landscape, their scarps and hollows nurturing sub-types of endangered Cumberland Plain Woodland floras.
Ashfield Shale Floras
Ashfield Shale outcrop extends to higher elevations and into higher rainfall areas than Bringelly Shale. These include the North Shore where rainfall zones exceeding 1000 mm, and similarly the Bilpin–Mountain Lagoon area. Where the shale forms cappings that fringe the Illawarra escarpment the mean annual falls may exceed 1500 mm by a significant amount.
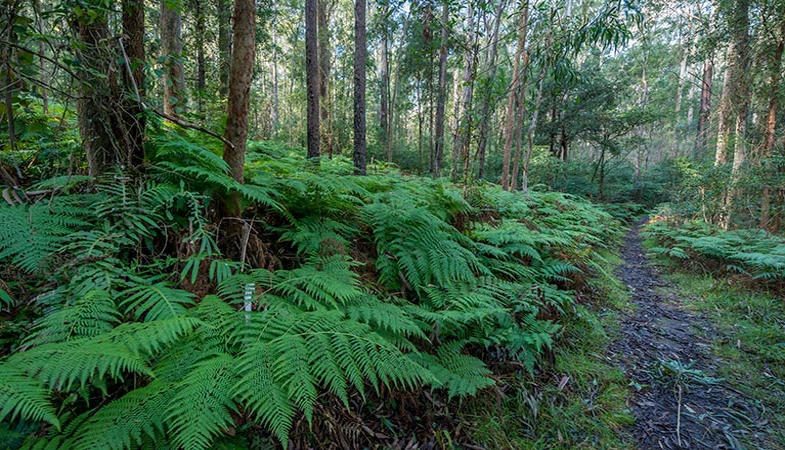
Blue Gum High Forest is familiar to most STEP members and needs little description here. Most members live within 10 min drive of Dalrymple-Hay and Sheldon Forest or can easily reach more far flung localities like the Blackbutt forest of Galaringi Reserve or the Blue Gum, Grey Ironbark forests of Rapanea Community Forest, both in the Carlingford area. But even more diverse treats are in store in the Blue Mountains where the Mountain Blue Gums Eucalyptus deanei and Monkey Gums E. cypellocarpa grow tall and stately in the endangered Blue Mountains Shale Cap Forest of the Bilpin area. These two are members of a cornucopia of eucalypt species as the community grades laterally into Sydney Turpentine Ironbark Forest and Shale Sandstone Transition Forest. Appearing are Grey Ironbark, Mountain Mahogany E. notabilis, Grey Gum, White Stringybark, Sydney Peppermint, and of course not forgetting Turpentine.
Have you visited the Illawarra Fly Treetop Walk at Knights Hill near Robertson? If not it's worth an outing, rounded off by a pie at the Robertson Pie Shop. The walk meanders through the crowns of two tall eucalypt forest species,
Gully Gum Eucalyptus smithii and Brown Barrel E. fastigata. Ashfield Shale sits atop a sheer cliff of Hawkesbury Sandstone protected by a large capping of Cenozoic basalt. The weather station at the pie shop records a mean annual rainfall of nearly 1600 mm.
Scheyville National Park near Pitt Town is perhaps the best place to look at lower rainfall communities on Ashfield Shale. It includes part of the former Pitt Town Common grazing lands whose pasture merges into tracts of quite dense woodland and forest. The dominant plant community is the critically endangered Cumberland Plain Woodland whose principal tree species are Grey Box Eucalyptus moluccana, Forest Red Gum E. tereticornis and Narrow-leaved Ironbark E. crebra. The forest floor is often grassy and may be sprinkled with quite delicate wildflowers like Blue Trumpet Brunoniella australis in spring and summer. Cumberland Plain flora shares many herb and shrub species with the tablelands and slopes of NSW but in the grassy ground flora you'll also be reminded of aspects of Blue Gum High Forest.
Bringelly Shale Floras
The Minchinbury Sandstone is so thin and it weathers so readily that, vegetation-wise, it is inseparable from the Bringelly Shale (or for that matter the underlying Ashfield Shale).
The Bringelly Shale supports a more varied range of Cumberland Plain plant communities than the Ashfield Shale described earlier. Because of the presence of sandstone beds and lenses, its country can be quite hilly, with sheltered slopes and valleys, and this has led to the creation of Shale Hills as distinct from Shale Plains woodlands as Cumberland Plain Woodland subtypes. Sheltered valleys and steep slopes have also nurtured additional communities such as Western Sydney Dry Rainforest and Moist Shale Woodland, both also listed endangered. However, rainfall nowhere reaches levels that would support tall blue gum forests like those on Ashfield Shale in Sydney’s upper North Shore or the lower Blue Mountains.
Reserves carrying native vegetation on Bringelly Shale are relatively small, widely scattered and often subject to weed invasion especially by African Olive, Lantana, privet species and African Lovegrass. They include Lansdowne Park, remnant pockets within Mt Annan Botanic Gardens, Mulgoa Nature Reserve, Shanes Park, and Wianamatta and Western Sydney Regional Parks including Kemps Creek.
In Western Sydney Regional Park you can wander from the main park areas into quite dense Spotted Gum forest, and into sheltered niches below escarpments formed by sandstone lenses which carry Moist Shale Woodland and Western Sydney Dry Rainforest, with odd ring-ins like White Mahogany Eucalyptus acmenoides amongst the Spotted Gums and Forest Red Gums. Understory species include Mock Olive Notelaea longifolia and Hairy Clerodendrum Clerodendrum tomentosum. Climbing plants are particularly diverse and include native Grape Cayratia clematidea and Gum Vine Aphanopetalum resinosum (from personal experience, too aggressive to grow in the garden).
Main reference: Herbert, C. (1979) The Geology and Resource Potential of the Wianamatta Group, Geological Survey of NSW Bulletin 25
This is the fourth in a series of articles by John Martyn on Sydney’s geology.
AABR Pioneers
The Australian Association of Bush Regenerators was established in 1986 out of concern for the continuing survival and integrity of bushland and its dependent fauna.
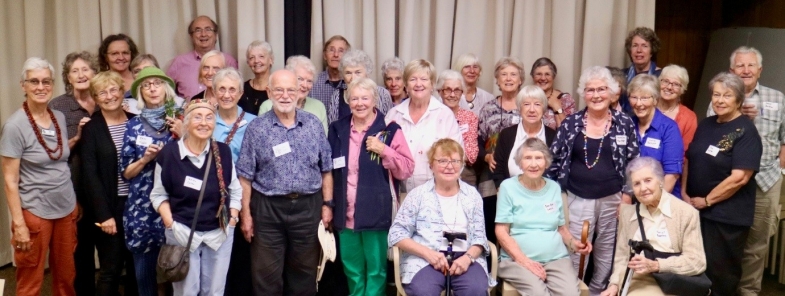
The AABR recently put on a lunch for what they called the pioneers of bush regeneration, those visionary and committed people who took the concept from the Bradley sisters, developed it, sat on committees, turned it into a tech course, wrote text books and generally created a new approach to bushland management. Apart of course from working in the bush themselves.
Ten Years of Blue Gum High Forest Protection
Sydney's Blue Gum High Forests built colonial Sydney. By the 1850s most had gone. However a few patches survived. The largest one was in St Ives. It was so rare, that Richard Dalrymple-Hay, NSW’s first Commissioner of Forests, acquired it as a demonstration forest. This became known as the Dalrymple-Hay Nature Reserve.
In 1934 Annie Wyatt – later to become the founder of the National Trust – led a community campaign to save this endangered forest.
Then again in 2007, the community led another campaign to acquire two privately owned blocks of land into public ownership and so protect the forest. To celebrate the tenth anniversary of this campaign, Friends of Ku-ring-gai Environment (FOKE) and STEP have organised some walks which highlight the beauty of Blue Gum High Forest and Janine Kitson is presenting a talk entitled The Battle of the Blue Gums.
FOKE Walk on Sunday 7 May – Dalrymple-Hay Nature Reserve
Time: 9:45 for a 10 am start (finish noon)
Meet: entrance to Dalrymple-Hay Nature Reserve (cnr Rosedale Road and Vista Street, St Ives)
Book: Janine Kitson (0428 860 623, 9498 2402, This email address is being protected from spambots. You need JavaScript enabled to view it.)
Nancy Pallin, one of the leaders of the campaign, will lead a walk demonstrating the unique features of this outstanding forest.
FOKE Walk on Sunday 14 May – Sheldon Forest from Turramurra to Pymble
Time: 9:45 for a 10 am start (finish noon)
Meet: ticket office, Turramurra Station
Bring: hat, water, snack and good walking shoes (involves walking up some steep hills)
Book: Janine Kitson (0428 860 623, 9498 2402, This email address is being protected from spambots. You need JavaScript enabled to view it.)
Sheldon Forest is one of Sydney’s rarest urban forests. It is within walking distance of not one, but two, railway stations – Turramurra and Pymble. The North Shore railway line forms a wildlife corridor that connects Sheldon Forest to other remnant forests in reserves and gardens. This ecologically focused heritage walk explores the unique relationship between the natural and built heritage of Ku-ring-gai and Sydney's forest history. It reveals layers of history – indigenous, colonial, federation, interwar, as well as revealing Australia’s rich biodiverse natural history. Discover why the resilience and protection of this magnificent Blue Gum High Forest is so important during a time of climate disruption and biodiversity extinction.
NPA Talk on Saturday 10 June – The Battle of the Blue Gums
Time: 10 to noon
Tutor: Janine Kitson
Book: https://www.weasydney.com.au/course/TBBG
During the 1930s, two forests were under threat – the Blue Gum Forest in the Blue Mountains and the Blue Gum High Forest in suburban Sydney. Discover how pioneer conservationists like Myles Dunphy and Annie Wyatt successfully rallied to protect these forests. How did these forest battles contribute to the modern Australian conservation movement? How are these forests faring today – at a time of burgeoning population increase, habitat loss and climate change?
STEP Walk on Sunday 18 June – Blue Gum Walk in Hornsby Valley
Why Give the Green Army its Marching Orders?
It’s a rare week when natural resource management policy penetrates the national news cycle not once, but twice.
Nonetheless, last Thursday the federal government struck a deal with the Greens to increase funding to Landcare programs by $100 million in exchange for their support on other matters. No one quite seems to know yet how this money will be spent – presumably in ways that support the thousands of volunteer community Landcare groups dotted around Australia.
Then on Sunday, the Australian Financial Review reported that the government will abolish the Green Army program as part of its mid-year budget update later this month.
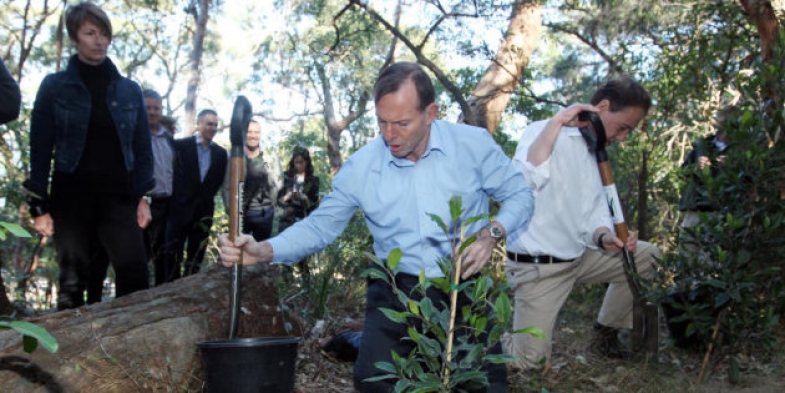
Introduced in 2014 as a signature policy under the then prime minister, Tony Abbott, the Green Army aimed to mobilise 15,000 young and unemployed people to work on conservation projects and receive complementary training. Axing the program would deliver budget savings of around $350 million.
Abbott took to Facebook on Monday to criticise the move. His main concern seems to be the implication that the Greens’ policy priorities are more important than the Coalition’s. That’s a bad look, he argues, for a 'centre-right government'.
Yet the move would arguably be very much in keeping with centre-right values. By reinvigorating Landcare’s model of personal responsibility and self-regulation, the government could reduce pressure to regulate land use or to pay landholders financial incentives to improve their environmental management.
But consistency with any particular political philosophy is not the issue here. The hyper-polarised political landscape of recent years, particularly on environmental policies, encourages parties to differentiate on any grounds they can. Thus, the cross-party support long enjoyed by Landcare can perversely work against it. Incoming governments believe they need new programs to claim as their own, diverting attention and resources from those already in place.
The $484 million cut to Landcare in the 2014 budget needs to be remembered in this context. Both Coalition and Labor governments have made changes over the years that either reduced the financial support available to community Landcare groups, or imposed more top-down modes of decision-making.
The 2015 Senate inquiry into the National Landcare Program revealed considerable community concern about the impacts of budget cuts on Landcare’s activities and on private commitment to natural resource management. Every dollar of public money invested in Landcare is believed to leverage between $2.60 and $12.00 of community and landholder investment.
When the Green Army was launched, many people questioned whether it would deliver this kind of value for money. With a three-year review of the Green Army due for release early next year (subject to ministerial approval), we might have expected to see some answers.
So why is the Green Army is being cut before the review? Perhaps the government is sparing itself the embarrassment of defending a program that is failing to meet its objectives. Perhaps, despite the critics, the findings would have been positive and the government is avoiding having to explain why the Green Army is being killed off anyway. Perhaps it’s just looking for easy budget savings.
Strategic plan?
Whatever the motivation, the biggest concern is the absence of a strategic and coherent approach to natural resource management policy in Australia. Major program changes are being made with limited consultation and transparency, and precious little evidence of planning.
At the same time, some policies and programs appear to be working at cross purposes. For example, tree clearing is increasing in much of Australia at the same time that some landholders are being paid through the Emissions Reduction Fund to conserve native vegetation.
Questions need to be asked about the genuine impacts of existing policy, about the way in which regulations intersect with voluntary programs, and about coordination between Commonwealth and state governments, among other issues.
The recent Senate inquiry into Landcare called for long-term investment and stability in natural resource management programs. Achieving this will require a return to genuine cross-party support coupled with broader community and industry support. The key to achieving this, I suspect, is less wheeling and dealing among political parties and more consultation and planning with all interested stakeholders.
It might be time to consider a white paper process to inform the next phase of natural resource management policy. At least that would give us some confidence policy is not being decided on the run.
Stewart Lockie, Director, The Cairns Institute, James Cook University
This article was originally published on The Conversation. Read the original article.
Australia Day Award for Helen Wortham

STEP is delighted that our secretary has received Ku-ring-gai Council’s Australia Day Award for Outstanding Service to the Ku-ring-gai Community (Individual).
Helen has been the key engine-room of STEP as a committee member since 1990 and secretary since 1997. She has devoted many hours applying her comprehensive skills to the operation of STEP. Her work has included maintaining the membership records, creating communication material, editing our newsletter and publications, promoting and selling our books and maps. More recently she has been the brains behind the modernisation of our website and the transformation of our newsletter distribution into the digital age.
Without Helen’s selfless devotion STEP could not have functioned successfully.
Sandstone-Shale Transition – the Mittagong Formation
The geology of the Sydney Basin changes dramatically at the top of the Hawkesbury Sandstone, which is followed upwards ultimately by the thick, shale-dominated Wianamatta Group. It isn’t an abrupt change but usually a transition, via several metres of alternating sandstones and shales called the Mittagong Formation. The quartz-rich sandstones of the Mittagong resemble finer-grained versions of the Hawkesbury Sandstone and they are interleaved with dark grey to black shales, siltstones and laminites.
Originally named Passage Beds by JF Lovering in 1954, the current name was adopted from a selected type locality, the Gib (Mt Gibraltar) railway tunnel at Mittagong, where the formation is 15 m thick. Elsewhere it is almost invariably less than 10 m and can locally be absent altogether. Exploratory drilling for the Epping to Chatswood railway tunnel at Macquarie Park, for example, encountered only a 2 to 5 m thickness of it.
The variability is in part due to the nature of the dwindling flood plain and braided river system which deposited the Hawkesbury Sandstone. This vast system eventually lost its strength and became a plain of scattered sandbanks, swamps and lagoons. Clays settled in the latter but were periodically overwhelmed by sand brought by late floods leading to a sandstone/shale alternation of very variable thickness.
For such a thin unit the Mittagong Formation has a disproportionate effect on vegetation because it usually creates a broad bench at the top of the Hawkesbury Sandstone’s steep rocky dropoffs and cliff lines. This leads to the retention of soils and can even collect downwash from overlying Ashfield Shale if present. Such level surfaces can also attract deep weathering and laterite formation.
Like the shale lenses in the Hawkesbury, Mittagong Formation forms richer soils than the sandstone but stonier, more lateritic and less fertile than those of the overlying Ashfield Shale. These yellowish soils are typically classified as belonging to the Lucas Heights soil landscape, highlighting similarities in the bedrock between Mittagong Formation and Hawkesbury Sandstone with its shale lenses in the Lucas Heights area.
Plant communities hosted by Mittagong Formation are diverse and usually gradational to those of adjoining shale or sandstone, often falling within the broad envelope of Shale Sandstone Transition Forest with either a sandstone bias or a shale leaning depending on setting. In other sites the communities may be more tightly defined in terms such as Sydney Turpentine Ironbark Forest, Turpentine Ironbark Forest, or where strongly lateritised, Duffys Forest. They tend to have one thing in common, they are mostly legally defined as threatened, mainly because they survive in narrow, disjointed enclaves isolated by land clearing.
Is it Possible to View the Mittagong Formation?
Not as easily as you might think, and only in artificial cuttings – natural exposures are virtually unknown!
 You can look at its type locality at the south-west end of the Gib Tunnel at Mittagong but only by telephoto lens through a security fence (see photo at the top of this page). It's also visible in cuttings along the M31 nearby, but at 110 km/h it's a case of ‘don't blink or you'll miss it’. The best locality is probably the road cutting of the Picton railway overbridge (see photo) though you'll have to park down the road and walk back in if you want to see it hands on.
In our own local area there are a number of rather poor and vulnerable artificial exposures, like the M2 cutting under the Barclay Road over-bridge at North Rocks. But this is currently being plastered in concrete by the North Connex guys and will soon largely disappear. The embankment of the Abbott Road eastbound feed-in lane to the M2 is good too but you can't stop there, nor can you for the south-west embankment of the M2 north-west of the Lane Cove Road interchange at Macquarie Park.
As for natural outcrops, when you stroll around in bushland on the flat ground above Hawkesbury Sandstone dropoffs you may see abundant shards of lateritised shale and siltstone in the soil, but unless you stumble on an erosion gully or creek line you'll be lucky to see anything more.
Sheldon Forest
Sheldon Forest is a pretty good start. Wander down past the scout hall to the sweeping apron of tall Blackbutt forest and you'll be descending from Ashfield Shale onto Mittagong Formation. As the track descends further towards the Hawkesbury Sandstone dropoff there is a marked increase in Turpentines, Sydney Red Gums and many shrubs of sandstone affinity such as banksias. But you don't have to return very far back uphill before shale species like the pea-flowered groundcover Tick Trefoils Desmodium rhytidophyllum and D. varians reappear.
Auluba Reserve
At roughly 3.5 ha, this is probably the largest area of Mittagong Formation bushland in the Lane Cove catchment. It's primarily Blackbutt forest very like lower Sheldon but several other tree species are present, notably Sydney Red Gum, Red Bloodwood and Red Mahogany, and both White and Narrow-leaved Stringybarks are present though these are rare, scattered and sometimes in poor condition. The shrub flora is rich and includes the critically endangered Julian's Hibbertia, H. spanantha. The Sydney region has a greater diversity of hibbertias than any other similar-sized region of Australia and H. spanantha will very likely not be the last new species to be discovered.
North Epping Oval Bushland
This sits above the sandstone on the opposite side of the Lane Cove Valley across from South Turramurra. It's a small area with a very diverse tree community, including Sydney Red Gum, Red Bloodwood, Narrow-leaved Stringybark, Sydney Peppermint, Blackbutt, Turpentine and Christmas Bush. The shrub Laurel Geebung Persoonia laurina, uncommon in the Lane Cove catchment, is quite common here.
Fred Cateson Reserve, Castle Hill
Located at the junction of Showground Road and Gilbert Road, this is a classic locality to walk from shale cap down across the Mittagong Formation and see key plant species. The lower parts of the reserve are Hawkesbury Sandstone but the crest of the rise bordering Gilbert Road carries shale and transitional flora, notably with trees like Grey Gum, White and Thin-leaved Stringybarks, Grey, Broad-leaved and Narrow-leaved Ironbarks, Red Mahoganies and Forest Red Gums. As you descend towards the sandstone, Red Bloodwoods and Black She-oaks assert their presence.
Fagan Park – Carrs Bush, Galston
A stones throw north of Galston, this popular area of grassy park, lakes and bushland straddles the sandstone–shale transition zone, though how much is Mittagong Formation and how much Ashfield Shale is hard to deduce on the ground. The bushland fringe along Arcadia Road is certainly on shale and you can find good specimens of White Stringybark, White Mahogany and Grey Ironbark. This changes north-eastwards, and if you enter the park from Carrs Road you will first see the odd White Mahogany and Grey ironbark but you will immediately enter an area of pure Turpentine forest, almost certainly hosted by Mittagong Formation soils.
This is the third in a series of articles by John Martyn on Sydney’s geology.
Have Your Say on Hornsby Quarry Development
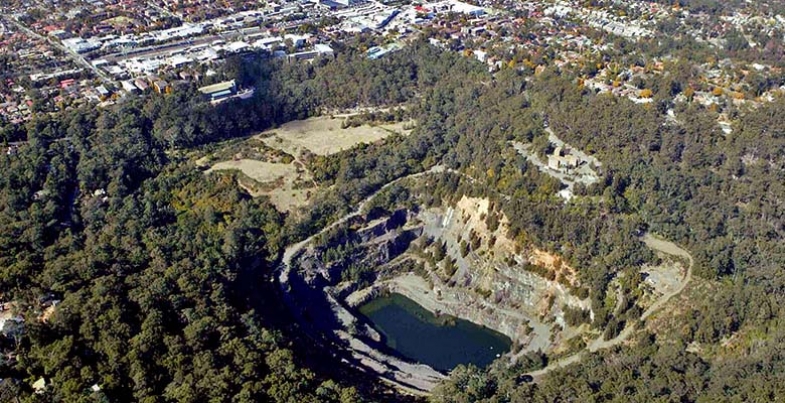
Hornsby Council has moved to the next stage of planning for the redevelopment of Old Mans Valley and the Quarry. There is an opportunity for you to make suggestions about how the area should be developed and used.
South Dural Development Stopped … For Now
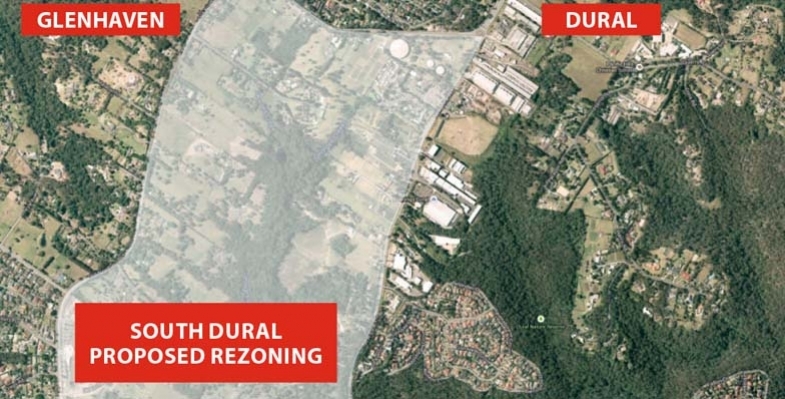
We've previously summarised our concerns about the application to rezone rural land to residential land. It is a relief that Hornsby Council has decided to discontinue evaluation of the proposal. But this is only until an infrastructure and funding plan is in place for this and other developments in this rural area.
Over 5,000 submissions were made opposing the development, many for reasons other than congestion along New Line Road and lack of other infrastructure. There will be more opposition to come when the developer has another go. With any luck the proposal will be deemed inconsistent with the North District Plan that aims to retain rural land.
Greater Sydney Strategy
It's important that as many people as possible comment on the Greater Sydney Strategy and the North District Plan by 31 March 2017.
Towards Our Greater Sydney 2056 is a 40 year vision that spells out the anticipated rate of growth and framework for employment and population distribution. How this is done will ultimately determine the long-term impacts on our natural areas, STEP’s chief focus.
For a city the size of Sydney, strategic planning over a 40 year period is important. However as outlined below there are matters of serious concern.
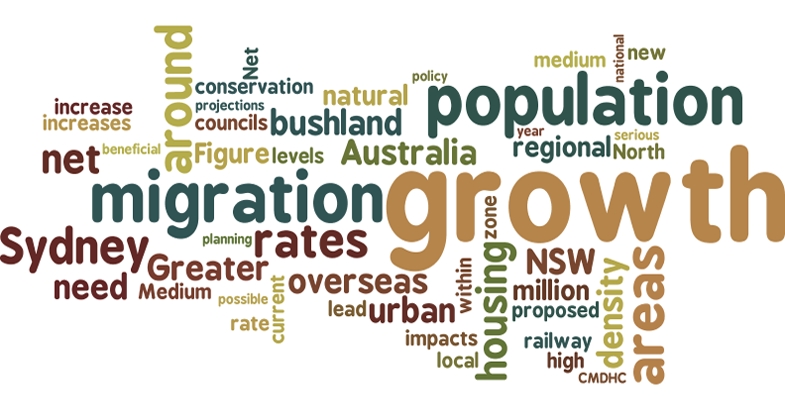
High Rate of Growth
On p8 there is this statement:
Greater Sydney is experiencing a step change in its growth with natural increases (that is an increase in the number of births) a major contributor. We need to recognise that the current and significant levels of growth, and the forecast higher rates of growth are the new norm rather than a one-off peak or boom.
Given the clear impacts of high growth rates on our urban amenity this statement needs closer scrutiny.
Refer to the table below for the projected growth rates and the figure below for the net overseas migration component.
| Region | Population 2011 | Projected population | ||
| 2036 | Change 2011–36 | % change 2011–36 | ||
| Greater Sydney | 4,286,350 | 6,421,950 | 2,135,650 | 49.8% |
| Rest of NSW | 2,932,200 | 3,503,600 | 571,400 | 19.5% |
From the figures the total projected increase in population in NSW from 2011–36 is around 2.7 million. Of this, for the same period, the total from net overseas migration is around 1.7 million, leaving the natural growth at around 1 million.
A recent report by the Planning Institute of Australia on population trends, Through the Lens: Megatrends Shaping our Future (p12) concluded:
Overseas migration continues to be the biggest contributor to population growth.
Net overseas migration for Australia since 1976 is shown in the lower figure. On p12 it says that:
Of the three basic factors determining population growth (fertility/births, mortality/deaths and migration) the net migration rate is most subject to policy intervention, and thus the most uncertain in future projections.
 Since the net migration rate is the primary determinant of Australia’s population growth and is controlled by government policy, it is clearly possible to regulate the overall population growth rates of Australia to ensure they are at acceptable levels and anticipated benefits are broadly realised.
The regulation of inflation by the Reserve Bank has proved beneficial relative to an unregulated economy. Regulation of Australia’s overall population level and age structure through adjustment of net migration targets by a Federal government agency could prove beneficial to planning within Australia. This agency has to work in concert with state governments that bear the brunt of the implementation consequences.
High growth rates are resource intensive, difficult to manage and can lead to significant long-term environmental impacts. In the past these have included a higher proportion of defective buildings, lags in required new infrastructure with traffic congestion increasing and damage to bushland and watercourses from greater urban stormwater run-off.
The current proposed annual growth rates of around 1.6% are too high and need to be reduced to the more manageable levels in the previous three decades of around 1%. The Mercer World’s Most Liveable Cities ranking indicates that beyond a population of around 6 million liveability declines. Sydney has to recognise that growth cannot be infinite and ultimately must plan for a zero net growth future.
The Greater Sydney Commission may not have a say in the growth projections but we think people should be able to express their views through the current consultations process and local federal and state MPs.
Urban Renewal
On p8 it states that the shorter term need for additional new housing capacity is greatest in the North and Central Districts. While this will lead to more high-rise development along the railway line it is important that urban conservation corridors are retained.
For example it is possible to walk from Gordon, Killara and Roseville Stations through high quality urban conservation areas to the bushland that leads to Garigal National Park. The value of these conservation corridor links from railway stations to our national parks can only increase with time.
Medium Density Infill Development
On p9 it states:
Many parts of suburban Greater Sydney that are not within walking distance of regional transport (rail, light rail and regional bus routes) contain older housing stock. These areas present local opportunities to renew older housing with medium density housing. Medium density housing is ideally located in transition areas between urban renewal precincts and existing suburbs, particularly around local centres and within the 1 to 5 km catchment of regional transport.
A 1 to 5 km catchment from the railway stations and regional bus routes would include virtually all of the North Shore. Future medium density in these areas is likely to be fast-tracked by developers using the NSW government’s proposed Complying Medium Density Housing Code (CMDHC).
Provided prescribed standards are met this could allow building density increases by as much as a factor of two without the need for consent. Because of its indiscriminate nature, for those areas impacted by the code, it could lead to increases in dwelling numbers significantly in excess of those planned for.
The CMDHC is proposed in extensive single dwelling R2 zones for those councils where multi-dwelling housing or dual occupancy is permissible in this zone. If one council allows multiple dwellings it will flow through to all the original member councils when they amalgamate.
Examination of the relevant LEPs indicates all the amalgamated councils in the North District will be impacted with the exception of Hornsby–Ku-ring-gai. STEP strongly opposes application of CDMH in any residential zone other than the medium density R3 zone.
Economic Priorities
On p7 there is a focus on the economic growth from inbound tourism. This would be a serious concern if our bushland and national parks are treated as assets for commercialisation. Sensitive natural bushland areas can easily be damaged from overuse and need protection. Private leasehold of areas with existing bushland and clearance for accommodation should not be supported.
Let’s Keep Turramurra Village Park
Ku-ring-gai Council has been developing plans to improve the Turramurra local centre over many years. As a resident of Turramurra for most of my life I can attest that the town centre has hardly changed in over 50 years.
Turramurra has the perpetual problem of being split into three sections by the railway line and Pacific Highway. There is no coherent centre for the community, just strips of shops, a couple of supermarkets and three car parks.
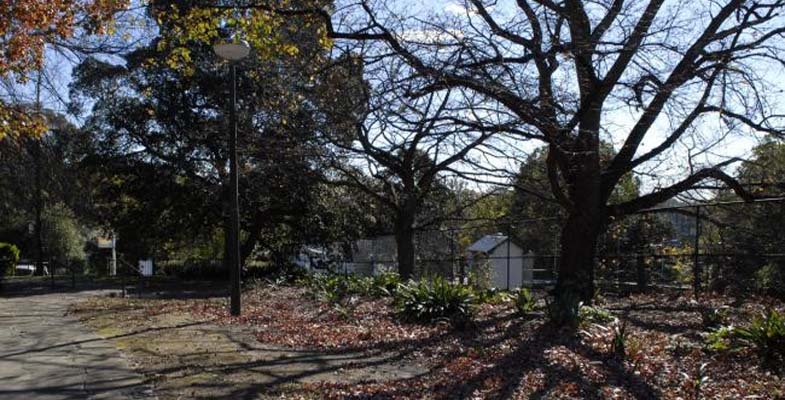
There is a small triangular park, called the Little Village Park, bordered by railway land, Pacific Highway and William Street. It is shaded by large trees that are mostly on railway land. Many of the trees are deciduous so the grass doesn’t grow very well because of the shade but it is very pleasant in all seasons. However there is little vegetation along Pacific Highway so traffic noise and pollution are not buffered. The land slopes away down to the exit from the station. There are a couple of seats but no other facilities.
The park has great potential to be a community space but council claims that it is under-utilised. Could that be because there is little amenity in its current state?
Council has developed a plan ‘to activate’ the Coles supermarket side to the west of the railway line, to be called the Turramurra Community Hub. Little Village Park was not included in the plan originally apart from funding being provided for an upgrade. (No one knows what will happen on the other side of the railway line. Woolworths did put up a proposal leading from the old post office site that remains derelict.)
However last year council proposed to add Little Village Park to the development plan by changing its current zoning as a public park (RE1) to be part of main B2 (local centre) zoning so the park could be developed as part of the Community Hub. The documents suggested a three-storey community centre be built on the land.
There was such an outcry that council held a public hearing. The independent chair recommended that the rezoning not proceed. Despite this, council staff still recommended that the rezoning could proceed and council voted 5 to 4 accordingly on 7 February.
Integration with the Rest of Turramurra
The park could possibly be integrated with development on the other side of the railway line and create a more coherent suburb. The station access bridge has been widened recently so could it be widened even more? But I am not an architect. This will not be possible once there is a large building butting alongside the avenue of trees along the railway line. This is an area with tall trees and the potential for further deep root planting.
The plans for the overall Community Hub development seem to include only concrete plazas with small trees competing with the reflective glare from all the apartment and commercial buildings. Little Village Park could remain an attractive oasis with picnic tables and a shady playground.
Is Australia Winning? (Postscript)

 The Institute for Economics and Peace has supplemented their Global Peace Index with a Positive Peace Report 2016. But be warned, at 94 pages, it’s not a light read.
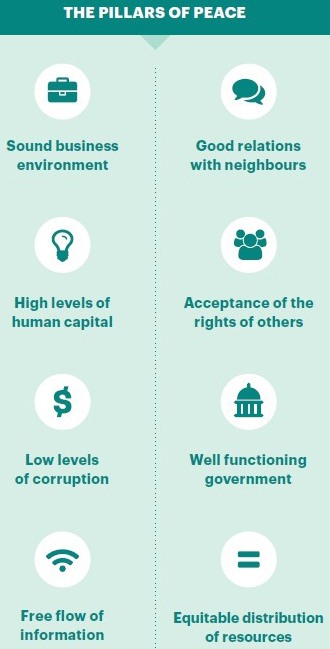
The framework used to measure positive peace is based on eight factors (pillars of peace) which are shown right, with a scoring system based on the winner having a low positive peace index (PPI) of near one (1) with others being higher.
Here are the top 15 countries in the PPI:
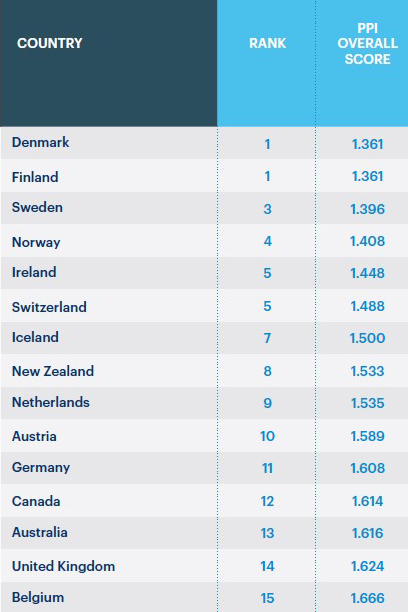
Given that the bottom countries have a PPI score greater than four, Australia’s 1.616 isn’t really too far behind the winner’s 1.361.
It’s worth looking at the winners by pillar:
| Pillar | Winner | Runnerup | Australia’s place |
| Well functioning government | Denmark | Finland | 6th |
| Low levels of curruption | New Zealand | Denmark | 7th |
| Sound business environment | Singapore | New Zealand | 3rd |
| Equitable distribution of resources | Sweden | Israel | 10th |
| Acceptance of the right of others | Sweden | Iceland | 8th |
| Free flow of information | Finland | Estonia | 19th |
| High level of human capital | United Kingdom | Ireland | 17th |
| Good relations with neighbours | Ireland | Austria | 64th |
Much as we might be discomforted by our placing in Information and Human Capital what a shocker that we could be 64th on neighbourliness.
Before we get too excited note that New Zealand is 54th which isn’t too far off our score. Does New Zealand have neighbours? One supposes so but they are all some distance away.
Page 41 documents the basis of the pillar Good Relations with Neighbours:
- hostility to foreigners- measures social attitudes toward foreigners and private property
- number of visitors- as per cent of the domestic population
- regional integration- measures the extent of a nation’s trade-based integration with other states
Number of vistors must be grossly unfair to both Australia and New Zealand because of the distance from other countries. Austria, which ranks second for neighbourliness, gets 25 million tourist arrivals a year or about 3.0 per head of population; Australia gets 7 million (less than 0.3 per head of population) source http://data.worldbank.org/indicator/ST.INT.ARVL.
One wonders if the Institute for Economics and Peace adjusts for length of stay by tourists. No one comes to our part of the world for a day or two whereas day visitors to Austria from border countries would be a significant proportion of the total.
The last item – trade integration – also raises queries. For starters is it really a matter for a ‘peace’ index? A country that promotes autarky (self-sufficiency, minimise imports) can still have peaceful relationships with neighbours even if some might be frustrated at the lack of export opportunities.
It’s a moot point whether trade data should be adjusted for the import component of exports, ie the exports have low value added if the import component is high.
Ireland ranks first under this pillar. It maybe that the main factor contributing to this is the high proportion of exports to GDP (about 40% per data published in Wikipedia) but to the extent that the exports consist of re-invoicing imports by multinationals to take advantage of Ireland’s tax competitiveness, Ireland is not a neighbourly country.
If we take out neighbourliness from the data and assume that all criteria have an equal weighting, Australia would move up to eighth position.
A quick word about other countries. The US ranks 19th, Brazil 63rd, China 85th, Russia 93rd and India 107th. Almost all the bottom countries are in Africa with Somalia the last of the 162 countries surveyed.
This a follow-up article written by Jim Wells to an article of the same name published in July 2016.
District Plans
Have your say on the North District Plan and the Greater Sydney Strategy by 31 March 2017.
District Plans cover the plan for growing Greater Sydney in detail. Sydney is divided into six districts and ours is the North District.
Increase in Number of Dwellings
The table below summarises the implied new dwelling requirements from the population growth rates adopted in the Greater Sydney Strategy.
| Council | Existing 2011 | 2011–16 | 2016–21 | 2021–26 | 2026–31 | 2031–36 | Change 2011–36 | % change 25 years |
| Lane Cove | 13,900 | 1,650 | 1,350 | 1,250 | 1,900 | 1,900 | 8,050 | 58% |
| Ryde | 44,050 | 4,950 | 6,250 | 5,650 | 5,100 | 5,000 | 26,950 | 61% |
| Hunters Hill | 5,400 | 350 | 150 | 150 | 200 | 250 | 1,100 | 20% |
| Northern Beaches | 103,800 | 4,950 | 2,900 | 4,050 | 5,100 | 5,400 | 22,400 | 22% |
| Mosman | 13,750 | 550 | 300 | 250 | 350 | 400 | 1,850 | 13% |
| North Sydney | 37,000 | 2,950 | 2,750 | 2,700 | 3,100 | 2,900 | 14,400 | 39% |
| Willoughby | 29,050 | 1,900 | 1,200 | 1,400 | 1,850 | 2,000 | 8,350 | 29% |
| Ku-ring-gai | 41,050 | 3,150 | 2,750 | 2,850 | 3,300 | 3,250 | 15,300 | 37% |
| Hornsby | n/a as boundaries have changed | |||||||
Here is an example of how the increase in dwelling numbers could come from replacement of existing houses with higher density dwellings. If the average replacement ratio is three new dwellings for one original dwelling in Lane Cove, around 4000 existing homes (around 30% of the suburb) would be replaced by 12,000 new terraces/townhouses over 25 years.
The sheer scale of new housing and infrastructure that will be needed to accommodate the increase in population over the period 2016–36 means that the character of northern Sydney will change. That will not be the end of it. The growth is not expected to stop once 2036 is reached!
The financing for this development could create pressure for sale of public land. Alternatively it could be financed by concessions in the height and location of high-rise. Dwellings near open space (including bushland) are more valuable and provide greater capacity for ‘value capture’. We see this approach in the proposals for development in South Dural where the developer is applying for approval of six storey buildings adjoining a riparian zone.
Protection of Native Vegetation
STEP’s main area of interest is the likely impacts of extensive further development on our existing bushland and native vegetation and what the District Plans have to say about the future development and management of these areas. We are also concerned about the environment of Sydney in general with issues like:
- Will natural bushland on public and private land be maintained and improved?
- Will the green canopy cover from street trees and suburban gardens be maintained?
- Will there be sufficient wildlife corridors and preservation of habitat, eg tree hollows?
- Will the planning regulations allow developers to remove excessive amounts of vegetation?
- Will there be preparation for climate change in management of riparian zones and foreshores?
The North District Plan is a frustrating document. It makes encouraging statements but then provides little detail on how the intentions will be actioned.
It emphasises the rich natural environment of the North District located in national parks and reserves, public and private land (p131).
It states that more effective outcomes can be delivered through planning at a strategic level that:
… can consider opportunities to connect areas of biodiversity, the relationship between different areas and threats to natural features.
Does this mean considering cumulative impacts and wildlife corridors?
The future status of natural areas is unclear. Natural areas that are currently cared for under council plans of management need to continue to have protection as a special category of public land use. The Department of Planning has been reviewing the State Environment Planning Policy 19 that defines protection of urban bushland for well over a year. We should have this information by now so we know how it fits in with the District Plans. We understand that Tree Preservation Orders are included in this review.
The whole process is a quantum change from the past where a regulatory planning system, such as SEPPs protected our natural areas. We now have a strategic planning system which facilitates further development intensity and the strength of the regulatory protection is unclear.
The future conflicts are exemplified by the stated objectives of strategic conservation planning (p132), for example:
- Maintain and where possible improve the conservation status of threatened species and ecological communities.
- Achieve better outcomes for biodiversity conservation.
- Facilitate urban growth and development and reduce the cost and timeframes for development approvals.
- Provide an equitable model recognising and recovering the cost of biodiversity impacts from urban growth (the questionable offsets system).
Specific Issues
Some examples of specific issues that need to be addressed in the North District include:
- Protection of Gordon Flying Fox Reserve – flying foxes are a keystone species that are essential for the cross-pollination of native trees and their ability to adapt to climate change.
- Ensuring critically endangered ecological communities including Blue Gum High Forest and other rare vegetation are protected by the classification as Nature Reserves. These reserves are isolated pockets that are encroached by housing development. Bushland buffers need to be maintained around these endangered forest areas as well measures to ensure that the trees are not damaged by urban stormwater.
- Recognition of the special environmental attributes of the northern areas with unique vegetation arising from high rainfall and Wianamatta Shale Soils.
- The need for an upgrading of the BASIX requirements to allow for more extreme rainfall events that are accelerating damage and erosion to riparian zones. This is particularly noticeable due to the high energy water flows associated with the steep catchments in the North District.
Green Grid
The development of the Green Grid through the Metropolitan Greenspace Program is lauded by the District Plan as an important part of promoting a healthy environment. Broadly the Sydney Green Grid program is all about improving recreational spaces and their accessibility, including access to national parks. STEP is very concerned if it includes developments like bike trails through uncleared bushland, or exploitation for tourism such as leasing public land within national parks for hotels and camping areas.
The North District Plan refers to a detailed report that outlines the conceptual approach behind the Green Grid that is on the website. On enquiry we discovered that it has still not been released. Lack of key information including the changes to SEPP 19 is unacceptable and undermines the purpose of public consultation of the North District Plans.
The Greenspace program is funded by regular grants. $3 million was provided in 2015–16 and $4 million in 2016–17. $50,000 is going towards improving bush tracks in Hornsby. There is no long-term commitment to fund the program.
The North District Plan identifies some priority projects (p137). The proposal for Lane Cove River area is a concern. The description is:
Enhancing open spaces along the Lane Cove River foreshores to create unique recreational experiences linking the Lane Cove National Park to Macquarie Park. Macquarie University, Chatswood and Epping.
Will this involve clearing national park land? Currently this area of the river provides highly diverse habitat areas for native animals. On a recent STEP walk 50 native bird species were recorded. Mountain bike trails have so far been excluded from the LCNP. The area needs protection from high recreational use.
We have an opportunity now to tell the Greater Sydney Commission what is needed to ensure that Sydney’s unique environment is not destroyed by population growth.
Delving Deep into Caves can Teach us about Climate Past and Present
Have you ever enjoyed the cool refuge that an underground cave offers from a hot summer’s day? Or perhaps you have experienced the soothing warmth when entering a cave during winter?
When descending into a cave, you may not only enjoy the calm climate, you may also admire the beauty of cave deposits such as stalagmites, stalactites and flowstones, known by cave researchers as speleothems.
Perhaps you already know that they grow very slowly from minerals in the water that drips off or over them. This water originates from rain at the surface that has travelled through soil and limestone above, and seeped into the ground and ended up in the cave.
As speleothems grow, they lock into their minerals the chemical signatures of the environmental and climatic conditions of the time the rainwater fell at the surface. So, as a stalagmite grows, the surface climate signature is continuously trapped in the newly created layers.
Some very old stalagmites hold climatic signatures of the very distant past, in some cases up to millions of years. They contain an archive of the past climate as long as their age, often predating global weather station records.
Above and Below
But if a cave remains cool during summer and warm during winter, how is its climate related to that of the surface? And how does this affect the chemical signature recorded by speleothems?
To understand the relationship between surface and cave climate, our research group, Connected Waters Initiative Research Centre at UNSW Australia, conducted multiple field experiments at the Wellington Caves Reserve in New South Wales.
During the experiments, the surface and the cave climates were measured in detail. For example, highly accurate temperature sensors were used to measure the water temperature at the surface, and at the point where water droplets hit the cave floor forming stalagmites.
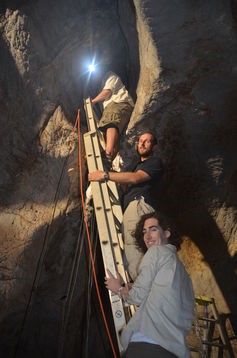
Installation of high-resolution temperature sensors inside the cave. Martin S Andersen
The research team initiated controlled dripping in the cave by irrigating the surface above the cave with water that was cooled to freezing point to simulate rainfall.
The cold water allowed us to determine whether the drip water in the cave is affected by the conditions at the surface or those along its pathways through the ground.
We also added a natural chemical to the irrigation water, which allowed us to distinguish whether the water in the cave originated from the irrigation or whether it was water already present in the subsurface.
Our results revealed a complex but systematic relationship between the surface and the cave climate. For example, surface temperature changes are significantly reduced and delayed with depth.
Our research illustrates how to decipher the surface temperature from that in the cave. Understanding this is necessary to correctly decoding past surface temperature records from their signatures preserved in stalagmites.
Keeping it Cool
We also discovered that air moving in and out of the cave can cool cave deposits by evaporating water flowing on the cave deposits. This cooling can significantly influence the chemical signature trapped in the cave deposit and create 'false' signals that are not representative of the surface climate.
In other words, it will make the surface climate 'look' cooler than it actually was, if not accounted for. While this is more likely to occur in caves that are located in dry environments, it may also have to be considered for stalagmites in caves that were exposed to drier climates in the distant past.
Our new knowledge can also help scientists select the best location and type of stalagmite for the reconstruction of past climatic or environmental conditions.
This new discovery is significant because it can improve the accuracy of past climate signals from cave deposits. It may also help us understand previously unexplained artefacts in existing past climate records. By improving our understanding of the past climate we can better understand future climate variations.
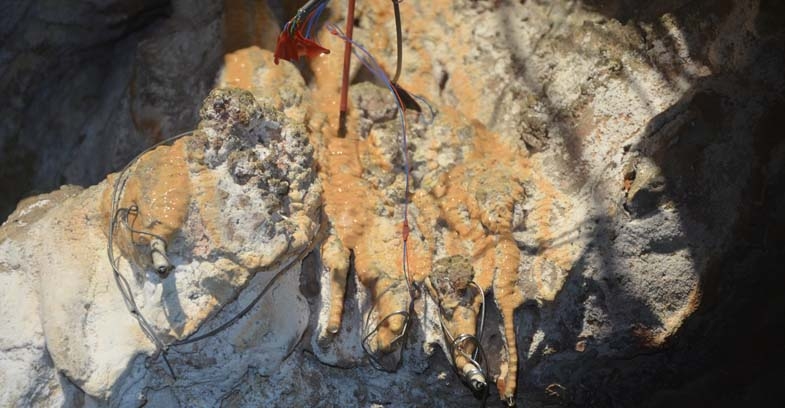
(![]() Photo at the top of page is of temperature loggers installed on stalactites to measure the drip water temperature. Martin S Andersen)
Photo at the top of page is of temperature loggers installed on stalactites to measure the drip water temperature. Martin S Andersen)
Gabriel C Rau, Associate Lecturer in Groundwater Hydrology, UNSW Australia; Andy Baker, Director of the Connected Waters Initiative Research Centre, UNSW Australia; Mark O Cuthbert, Research Fellow in Hydrogeology, University of Birmingham, and Martin Sogaard Andersen, Senior lecturer, UNSW Australia
This article was originally published on The Conversation. Read the original article.
Annual Report for Year to Oct 2016

In last year’s Annual Report I noted the transformation happening in Sydney and the unknown impacts on our bushland, the preservation of which is the primary focus of STEP’s activities. We are none the wiser with major pieces of legislation still in the formative stages. So the focus in 2016 has been on broader rather than local issues.
Committee
We are lucky to have a committee with a wide range of skills including ecology, landscape and bushland restoration, the intricacies of planning regulation and web communications. These people have been hardworking committee members for many years. We would welcome new ideas and experience. We recently emailed a survey aimed at discovering if there are any members, or people members may know, who could contribute in some way to STEP’s activities.
I would particularly like to thank Helen Wortham for the fantastic work she has done in getting the new website up and running and setting up the system for emailing the newsletter. Many hours have gone into getting the email addresses updated and developing a presentation that is very clear and attractive.
I would also like to thank Frank Budai for all his work over the past 3 years as treasurer, keeping track of our finances and organising the audit of our financial statements. Frank has resigned so we are looking for a new treasurer.
Publications
We have reduced the prices of our books and sales have been similar to recent years. Map sales are still solid. Our maps are more detailed than generally available on-line and there is no better way to plan a walk than poring over a full-size paper map.
The new Lane Cove Valley map is about to be printed using the more durable ‘stone’ paper that is waterproof. We are thankful for having a large team of volunteers who have been ground checking the new map that has been masterminded by John Martyn. Copies will be available before the end of the year.
Accounts
Our finances show a deficit of $3,550 for the year to 30 June mainly from a write down in the value of our stock of publications. Until now the major expenditure item has been the cost of production of the newsletter. This cost will be lower in future because of the use of email for distribution.
We have maintained the Environment Protection Fund which provides Deductible Gift Recipient (DGR) status for donations that support STEP’s environmental objectives. We received a total of $350 in donations in the past financial year. The government has been reviewing the criteria for providing DGR status. The current recommendation from a parliamentary report released just before the election is that this status should apply only if at least 25% of an organisation’s expenditure relates to on ground environmental work, however that can be defined. There is a risk that many environmental organisations will lose their DGR status.
Electronic Media
Our website has been upgraded and rebranded so that there is full functionality on tablets and smart phones and well as old-fashioned computers. New features include a secure shopping cart where you will be able to order and pay for publications and membership on-line. There is a simple system for registering for our walks. If you haven’t had a look, please do.
Trish Lynch creates an innovative Facebook page with an attractive selection of photographs and alerts of current local events and issues.
John Burke looks after our Twitter feed with incisive comments on current environmental affairs.
Education
We support the Young Scientist Awards run by the Science Teachers’ Association NSW with a prize in the environmental sustainability category. The winner of our award in 2015, Jade Moxey went on to win the overall Young Scientist of the Year and international awards as well. She has extended her project this year and is again our winner. There was another worthy project so we have also awarded a runner up prize this year. It is great to see the interest the students have shown in environmental research.
The Environment Protection Fund can be applied to educational and research projects. Ideas and proposals are welcome.
Talks
We organised public talks over the past year on Sydney’s birdlife, the unique geology revealed by the Hornsby Quarry, Wahroonga Waterways Landcare, exploration of the seafloor and land snails.
We did not manage to organise a STEP lecture last year as the potential speaker was not available.
Walks
STEP organises a walk every month or two (eight since our last AGM) in both our local area and further afield. Two of the walks focusing on birds were very popular. We also introduced members to some very different plant communities in western and south-western Sydney. The walks aim to be educational and to encourage new walkers so most walks are not physically challenging. We thank Andrew Little and John Martyn for organising and leading walks. If you have a request for a walk please let us know.
Newsletter
Our newsletter, STEP Matters, is our main means of communicating events, our activities and issues with our members. We also include other articles with an environmental angle that will be of interest to members. The newsletter is also sent to local councillors and politicians. We welcome alerts from our members of local events and developments and, of course, feedback on articles is always welcome.
We are now emailing the new editions to the majority of members and a few members still prefer a hard copy in the post. All past editions are available on our website going back to scans of the typewritten versions from 1978.
Environmental Issues
Despite the huge opposition on scientific and sustainability grounds to proposals to change the biodiversity conservation and land clearing legislation the Baird Government has given no hint that it is listening. There are also proposals to change Crown Land management that could have the potential to encourage commercialisation and alienation of green spaces. We are soon to be invited to comment on a broad picture framework for the development of Sydney over the next 20 years as set out in District Plans drafted by the Greater Sydney Commission. STEP’s major concern is whether there will be adequate provision for the maintenance of healthy bushland and tree canopy within our suburbs in the face of rapid unsustainable population growth. We urge everyone to get involved by sending comments to the Greater Sydney Commission.
Then there is the prospect of council amalgamation hanging over our heads. It is likely there will be a period when we will have no local representation with decision making taken over by an administrator appointed by the government. Once amalgamation is bedded down there is uncertainty about the application of planning instruments where, for example building standards or tree preservation orders could be set at a common standards that will lead to denser development in low and medium density residential areas and loss of the current treed character and amenity of many Sydney and other coastal areas.
One local issue is the outcome for the Hornsby Quarry after it has been filled with spoil from the NorthConnex tunnels. We have been unable to get any assurances that the rock face of the volcanic diatreme will remain visible.
New Lane Cove Valley Map
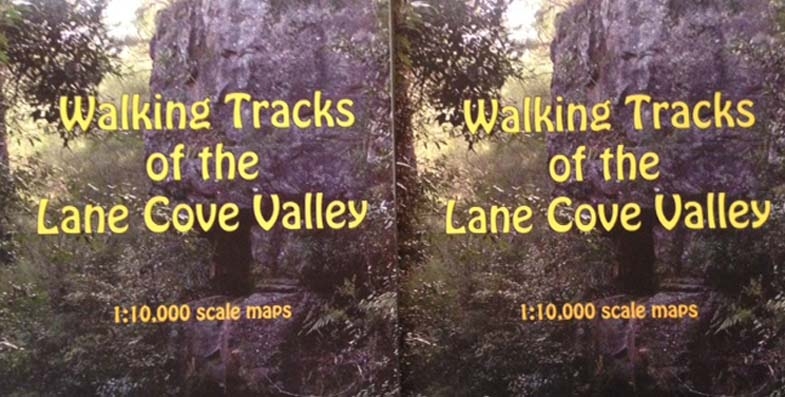
Yes, the brand new Lane Cove Valley map is now available. It has been produced by John Martyn with his keen eye for detail and clarity. We are grateful to have had the assistance of a team of walkers who checked the details of the tracks and names of streets etc.
The map covers a larger area than the old map going further north and west to cover the major connection points from the North Shore railway line and Pennant Hills.
The price is $15. For STEP members the price with the usual 30% discount is $10.50. Order your copy now!
Please note that you do not need to have a PayPal account in order to use PayPal to make a payment.
Warrimoo Mountain Bike Track – Some Good News
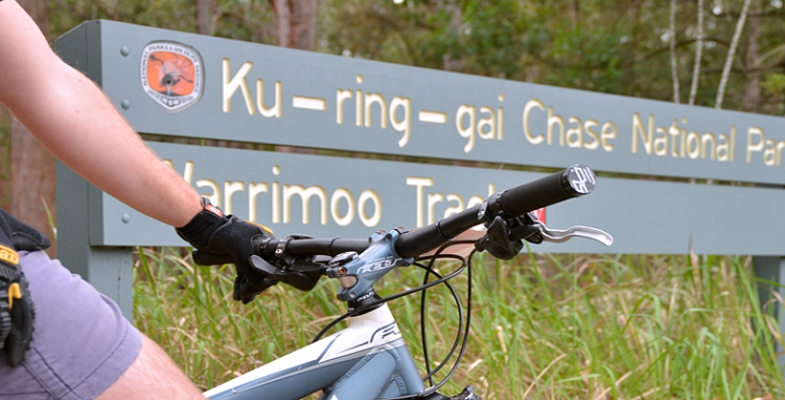
Previously we've reported on Ku-ring-gai Council’s closure of the mountain bike downhill track that had been constructed illegally near Warrimoo Oval in St Ives. After strong protests from the mountain biking community, including attempts to remove the fencing used to close the track, council undertook to commission independent ecological and safety investigations into the track. In July 2016 council announced that the research supported its decision to close the track so this will happen permanently.
This track has been evolving over several years and was tolerated by council under the Unstructured Recreation Strategy even though it was constructed without approval. However the listing of Coastal Upland Swamps as an Endangered Ecological Community (EEC) in 2012 under the NSW Threatened Species Conservation Act 1995 changed all that. A determination to list Coastal Upland Swamp as an EEC under the federal Environment Protection and Biodiversity Conservation Act 1999 was made in 2014, further strengthening the need for protection and the legislative requirement of council as the land manager to ensure its protection.
Key Findings from the Independent Report
The independent assessment determined:
that the creation and use of the mountain bike track has had a detrimental impact on the local occurrence of the Coastal Upland Swamp EEC and threatened species and their habitats.
The threatened species include Melaleuca deanei, Tetratheca glandulosa, Eastern Pygmy-possum, Rosenberg’s Goanna and Red-crowned Toadlet within Ku-ring-gai.
It also deemed the mountain bike activity ‘not sustainable’ due to the loss of vegetation and habitat, soil loss and irreversible localised changes to hydrology.
If use of the track were to continue, further degradation of the EEC and threatened species habitats could be expected:
A significant amount of work would be required to bring the track up to IMBA standards and these works are not recommended as they would cause further damage to the environment.
Council is currently looking into possible alternative sites that may accommodate downhill mountain biking in an ecologically sustainable way. The area at Lovers Jump Creek Reserve (Golden Jubilee) is the best and most suitable site. If council were to pursue track development a more detailed impact assessment would be required.
Having Trouble with Plant Names?

Knowledge of some of the common endings of scientific names can help to make names less forbidding. It is well worthwhile learning some of them.
A plant named after a person may end in ‘i’, ‘ii’, ‘iae’ or ‘ana’:
- -iae indicates that the plant was named in honour of a female, e.g. Acacia kettlewelliae from the subalpine areas of Victoria was named in honour of Mrs A Kettlewell, who was one of the founders of the Wattle-day League in 1909
- -i or -ii indicates that the plant was named after a male, e.g. Acacia beckleri was named in honour of the German born Dr Hermann Beckler, and Acacia williamsonii after Herbert Williamson, a teacher and botanist – usually (but not always) an i or ii ending means that the person named was the first to find the plant
- -ana indicates that the plant was named in honour of someone other than the finder. Acacia baileyana was named after FM Bailey, a prominent Queensland botanist. Sometimes the -ana ending is used after a place name, e.g. Eucalyptus papuana, the Ghost Gum of Central Australia
- -ensis indicates a native of the area named, e.g. Eucalyptus delegatensis is from the town of Delegate in south-eastern NSW. Note that austalis means southern and australiensis means inhabiting the south
- -oides means ‘resembling’, e.g. Acacia asparagoides is asparagus-like
- -cola means ‘native of’, e.g. Acacia saxicola is an inhabitant of rocky places
- -ella means ‘diminutive’, e.g. Dianella is the diminutive form of Diana
- -escens means ‘becoming’, e.g. Acacia glaucescens means becoming glaucous (powdery white)
- -osus or -osa indicates ‘abounding in’, e.g. the Common Fringe-lily Thysanotus tuberosus is abounding in tubers, and Acacia dentulosa is abounding in teeth
- -folia or -phylla refers to the leaves, e.g. Acacia brevifolia has short leaves, Acacia juncifolia has juncus (rush like) leaves, Acacia aciphylla has sharp, needle-like leaves, while Acacia aphylla is leafless. Acacia genistfolia has leaves resembling those of Genista (the brooms)
- -issima means ‘very’, e.g. Acacia aculeatissima is very prickly, and Acacia elegantissima is very elegant
- -ata indicates ‘a little’, e.g. Acacia crenulata has leaves a little bit crenulated (toothed) and Prostanthera denticulate has little teeth on its leaves
- -dentata means ‘toothed’, e.g. Acacia bidentata means two toothed
So next time you see Eucalyptus balladoniensis you will know that there is a town or district called Balladonia, and because there is a eucalypt called Eucalyptus burracoppinensis, there must be a place called Burracoppin.
And Eucalyptus brockwayi was named after Mt Brockway. One of the plants in the local bushland is the Bedstraw, Gallum gaudichaudii, so there must have been a Mt Gaudichaudi. And Acacia victoriae was named after a female, actually a queen. If it was named after Victoria, it would have been called Acacia victoriensis.
But some names are a simple giveaway, such as Persoonia hirsuta, the hairy geebung.
This article has been reproduced with permission from an item in Blandfordia, the magazine of the Australian Plant Society NSW Ltd, North Shore Group
Lane Cove Valley Metrogaine
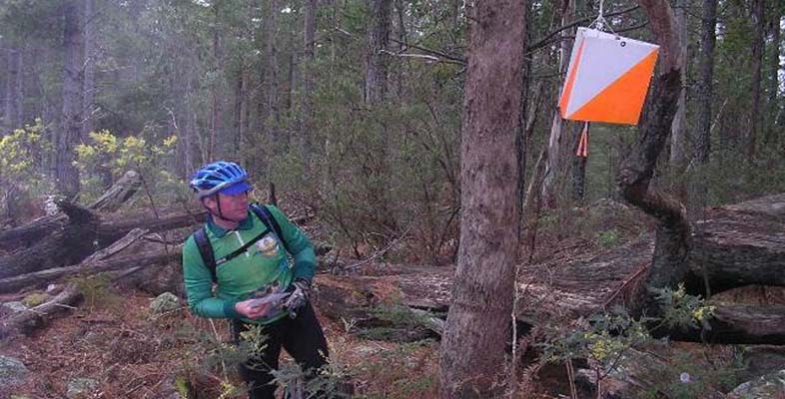
On Saturday 25 February 2017 the NSW Rogaining Association is holding LaneCoveRivergaine3, backing up the very successful LaneCoveRivergaines 1 and 2 in 2015 and 2016.
Rogaining involves teams of 2 to 5 people navigating to checkpoints marked on a map.
This is a great community event. Over 400 entrants of all ages (6 to 80+) and abilities are expected – from elite athletes to walkers and families. You get to choose your own route and level of difficulty and how long you take, within the 6 hour time limit.
You don't need special gear. Comfortable jogging or walking shoes and appropriate clothing are fine. Food and water should be carried, though bubblers and shops are located throughout the area and are marked on the map. A compass isn’t essential, but would be useful.
Start (11 am) and finish will be at Blackman Park, Lloyd Rees Drive, Lane Cove.
Instruction will be available for all first timers. Just form a team and register on-line (in January).
Enquiries: 0419 663 539 or This email address is being protected from spambots. You need JavaScript enabled to view it..
As for the two previous events, John Martyn has modified the STEP map of Walking Tracks of the Lane Cove Valley for the event. The location is the lower Lane Cove River Valley from Epping Road Bridge to Fig Tree Bridge, and surrounding suburbs. And John has helped to identify the most spectacular tracks and vistas for the event.
NSW Government Ploughs on with Controversial Legislation
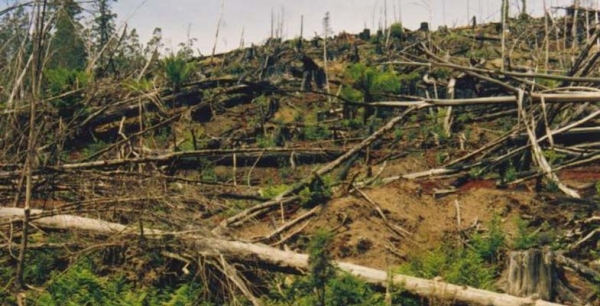
There has been a flurry of legislative action and announcements during the final months of the year following varying periods of consultation. The concerns about the legislation have been covered in recent issues of STEP Matters and more details are provided by the peak bodies leading the campaigns, the Nature Conservation Council and Total Environment Centre. Here is a brief update concentrating on the implications for urban areas.
Crown Land Management
The new Crown Law Act was pushed through state parliament on 9 November. The government claims that the new legislation will reduce complexity and deliver better management. It is expected that commencement will be in early 2018 after the required policies and systems have been prepared.
Submissions to the inquiry pointed out that, in fact, the problems with the current legislation are with administration, not the act itself. There are many examples of the misuse of crown land, for example the Talus Reserve in Willoughby that Willoughby Council allowed to be taken over by commercial interests that have generated a private profit.
Under the new legislation crown land may be transferred to local government or vested in other NSW government agencies. It is unclear whether they will be given the financial resources to carry out these new responsibilities. It seems there would be no barriers to councils classifying the land as operational land that could be sold or leased for development without any community consultation. Time will tell!
Climate Change Policy
One item of good news is that the NSW government announced a policy to reduce greenhouse gas emissions to zero by 2050. The announcement documents contain lots of statements of intention but most of them are dependent on federal government policy and action.
The sincerity of the government’s policies are now called into question. A Climate Change Fund was established by the NSW government in July 2007 to help households, businesses, community organisations, schools and government to save water, energy and greenhouse gas emissions. We now learn that the $240 million for private land conservation under the new Biodiversity Act will come from this same fund ‘to help landholders and land managers reduce the impacts of climate change on natural systems’.
Biodiversity and Land Clearing Laws
On 17 November the biodiversity laws were passed with the help of the Shooters and Fishers and Fred Nile’s Christian Democrats in the Upper House. Over 7,000 submissions were received with the majority expressing alarm about the prospects for increased land clearing and relaxed biodiversity offset provisions. Some minor changes have been made to the draft bills:
- Some vitally important areas will be excluded from the land clearing codes which means that it will be harder for farmers to clear them. These areas include coastal and Ramsar wetlands, littoral rainforest, core koala habitat, critically endangered ecological communities, old growth forests and high conservation value grasslands.
- The act ensures that the Office of Environment and Heritage will remain responsible for compliance and enforcement of the legislation, rather than the Department of Primary Industries as the government originally suggested.
- The Minister for the Environment and Minister for Primary Industries have the power to stop the use of land clearing codes under certain circumstances which is significant due to the expansion of codes under the new legislation.
- The use of biodiversity offsetting is greatly expanded under the new legislation which is a significant concern, however the final legislation has improved the offsetting provisions by requiring the minister to ensure that offsets result in ‘no net loss’ of biodiversity. This creates the opportunity to pressure the minister to adopt a more strict interpretation of offsetting that will have tangible result for bushland across the state.
Further consultation will occur on regulations that are yet to be released on aspects such as ‘red lights’ for development that impact on critically endangered species, testing of the Biodiversity Assessment Method that will determine how the impacts of development on biodiversity are managed and the long awaited State Environmental Planning Policy that will decide the fate of urban vegetation and biodiversity.
The government is still trumpeting the benefits that will come from private conservation actions but it is unclear how this can compensate for lost vegetation and habitat in other areas and that there will be sufficient long-term funding. In fact it has recently been discovered that the Climate Change Fund has been raided to provide funding for private land conservation.
Draft land clearing codes and regulations will be released early in 2017 for consultation.
Greater Sydney Commission District Plans
The much anticipated District Plans were released on 21 November. Submissions may be made up to the end of March and the intention is to finalise the plans by the end of 2017.
The District Plans cover the next 20 years. The overriding document is the Plan for Growing Sydney that covers development up to 2056. Over this time Sydney’s population is projected to grow from the current 4.6 million to 8 million.
On first perusal the District Plan for northern Sydney appears to recognise the value of our bushland and coastal environments. The detail is not available on how Local Environment Plans can be used in future to ensure the preservation of wildlife corridors and local bushland as well as national parks.
At forums organised by the Better Planning Network, commissioners have emphasised social and economic aspects of the plans. The environment seems to be a poor relation instead of being a vital consideration that will impact on socio-economic outcomes. For example, who wants to live in a concrete jungle of high rise apartments with no shade or natural landscape nearby?
The consultation period provides an opportunity for the public to reinforce the importance of maintaining healthy quality green spaces, bushland and national parks that are identified in the District Plans. Please write a submission.
Review of Direct Action’s Ability to Meet our Greenhouse Commitments
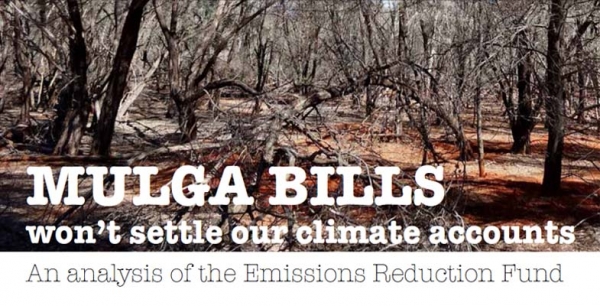
In November the Turnbull Government ratified Australia’s commitment to comply with the Paris Agreement on Climate Change. Australia has set a target to reduce emissions by 26 to 28% below 2005 levels by 2030, which builds on the 2020 target of reducing emissions by 5% below 2000 levels. The 2030 target is equivalent to about 13% below 2000 emission levels so the 2030 target is not as good as it sounds.
Currently the government’s main plan to reduce greenhouse gas emissions to meet our obligations under the Paris Treaty is called the Direct Action Plan. Introduced in 2014, the scheme operates by reverse auction, funding projects voluntarily proposed by the private sector. Projects are selected on the amount of greenhouse gas emissions expected to be abated at the cheapest price. So far $1.7 billion has been allocated out of a budget under the Emissions Reduction Fund (ERF) of $2.55 billion over 4 years.
Direct action also involves an emissions ‘safeguard mechanism’ to discourage large emitters from increasing their emissions above historical benchmarks. It commenced on 1 July 2016. It is not clear yet whether the rules will be effective in controlling increases in emissions.
This article draws on two recent analyses of the effectiveness of the Direct Action Plan:
- Paul J Burke, Undermined by Adverse Selection: Australia’s Direct Action Abatement Subsidies, Australian National University, April 2016
- Margaret Blakers and Margaret Considine, Mulga Bills won’t Settle our Climate Accounts: An Analysis of the Emissions Reduction Fund, The Green Institute, November 2016
Risk of Adverse Selection
Paul Burke questions the effectiveness of the direct action projects because of fundamental flaws in the scheme design:
- There is no way of preventing the direct action scheme subsidising projects that would have gone ahead anyway. For example funding has been provided for replacing machinery that is inefficient and upgrading lighting in supermarkets. These projects would provide a financial benefit to the proponent in any case so a subsidy has no justification.
- The international rules of carbon accounting require additionality. This means that credit for emissions reductions must not include changes that would have occurred anyway, say, because of legislation.
- The information about emissions expected to be abated will depend on a definition of baseline emissions, that is, what emissions would have been if the project had not been implemented. It is the proponent’s responsibility to identify their baseline in accordance with approved methods, and there is some flexibility. The government’s inability to know true project baselines creates a major challenge. Projects with overgenerous baselines will be able to submit relatively low auction bids because the abatement they offer will be easy to achieve, and thus cheap. These bids are well placed to secure funding. If the baseline is higher than business as usual, in the end the project will deliver less abatement than notionally indicated.
Effectiveness and Value for Money of Abatement to be Delivered
Margaret Blakers and Margaret Considine have undertaken the first ever analysis of the ERF auctions. They found that direct action not only fails its own test of delivering ‘real and additional’ emissions reductions, but also that it cannot serve as the foundation for more serious action without very substantial changes to its architecture. Their key findings are:
- Large sums of money (around $1.2 billion) have been poured into protecting land sector carbon. At the same time there is no federal policy safeguarding existing landscape carbon stocks. They are turning a blind eye to state governments rolling back land clearing controls. The entirety of the abatement purchased by the ERF so far (143 Mt CO2-e) at a cost of $1.73 billion accounts for less than 20% of projected emissions from land clearing up until 2030.
- Over half of all abatement comes from just two mulga-dominated bioregions in south-west Queensland and western NSW. The value of ERF contracts in and around these regions is about $1 billion. With carbon payments estimated to average $195 per hectare, this represents many times the per hectare value of land in the region. Paul Burke makes a similar point. This situation only applies to land with existing land clearing permits predating 1 July 2010. The payments rest on the assumption that clearing would have happened without the subsidy. No doubt some vegetation has indeed been preserved, albeit at a high price. Some of the spending has questionable additionality, however, given that the incentive to clear was anyway rather low (clearing is expensive and the productivity of the land is low).
- Much of the scheme’s expenditure has either been wasted or is at risk due to doubtful additionality (as per Paul Burke’s examples) and lack of permanence. 25% of ERF abatement has a ‘permanence’ period of only 25 years, after which time landholders regain ‘full land-use flexibility’. As well, the concentration of abatement in the semi-arid mulga regions carries its own risks such as from drought and climate change itself.
Fundamentally the ERF abatement profile is at odds with Australia’s emissions profile. Over 80% of our emissions are from industry, but 80% of direct action abatement is from the land sector. Only 4% is from the energy and industrial processes sectors, which produce most of Australia’s emissions.
Inadequacies in Methods for Vegetation Abatement
All the methods apply to ‘forest’ which is defined under the international rules. No methods are available at present for non-forest native vegetation or existing native forests on public land. Native forests on private land protected by legislation or covenant do not qualify because they are required by law to be protected.
Most landscape carbon resides in natural ecosystems. If well-managed, these will be resilient and are likely to persist and accumulate large carbon stocks in soils and plants over decades and centuries. Natural ecosystem management requires coherent, continental-scale policies and funding for the long term coordinated by the states and Commonwealth, not the ad hoc project funding that direct action provides.
The ERF is failing the climate, failing the land sector and failing the budget. To be credible, Australia’s climate policies must address the land sector in its own right and must stem the loss of carbon from the landscape caused by clearing, logging and other forms of degradation.
Ultimately the only effective long-term strategy to reduce Australia’s greenhouse gas emissions is to place a direct price on emissions.
Young Scientist Awards 2016

In 2015 the winner of STEP’s prize for a project relating to an environmental issue was awarded to Jade Moxey from Sapphire Coast Anglican College This year she has done it again with a project that extended her previous research that scotched theories that cattle grazing can stop the spread of weeds. She showed that fireweed is similarly not controlled through sheep grazing. Then she showed great initiative in organising testing of whether the toxic alkaloids in fireweed have the potential of health impacts for sheep and humans.
We also decided to give a highly commended prize to Darryl Domer and Carlos Meier, home schooled, for an evaluation of cell grazing compared with conventional open paddocks. They found that cell grazing provided significant economic and ecological benefits including increases in water use efficiency, pasture productivity and plant biodiversity. The results showed that that cell grazing could provide a potential solution to global food security when applied to a larger scale.
Marian Haire awarded STEP’s prizes.
South Dural Rezoning Proposal is Alarming
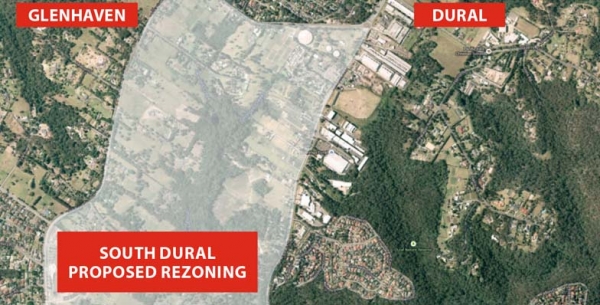
South Dural Residents and Ratepayers Group, a developer initiated lobby group, has made numerous applications since 1990 to Hornsby Council for the rezoning of 240 ha of rural lands in south Dural for urban purposes. The latest attempt is currently under consideration. Click here for details of the history of the lobbying
In the latest attempt, consultants’ reports have been commissioned as part of the first step of the application, that is, to change the zoning from rural to various levels of residential density and recreational zoning. Submissions closed on 2 December.
The spine of the proposed development is an area of bushland along Georges Creek and another unnamed tributary of Berowra Creek. Indeed the developer is touting the natural views and the tall forest as a feature that will allow six storey apartments to fit into an ‘eco-friendly’ community. All in all the proposal is for 2,900 dwellings that could house 9,000 people.
The bushland is of high conservation value with areas of Blue Gum High Forest (10.5 ha), Sydney Turpentine Ironbark Forest (22 ha), Blackbutt Gully Forest (30 ha) and Shale Sandstone Transition Forest (1.4 ha). The first two listed are classified as critically endangered ecological communities under the federal Environment Protection and Biodiversity Conservation Act.
As the opposing residents’ group, the Galston Area Residents Association, points out there are many reasons to oppose the application, for example:
- it is inconsistent with the metropolitan plan to preserve remaining rural land
- current roads cannot cope with current traffic let alone that generated by the extra residents
- public transport is inadequate and the north west rail line is a long way away so buses will have to operate on clogged roads
- there is insufficient provision for schools, shops, recreation areas and other basic infrastructure
STEP opposes the rezoning application for three main reasons:
1. Inadequate vegetation data and mapping
The bushland area comprises about 64 ha, a quarter of the site. As large parts of the land are privately owned it has not been possible to carry out on the ground vegetation mapping. This applies in particular to the area of Blue Gum High Forest of about 10 ha. This is in the context of the total area of Blue Gum High Forest remaining in Sydney of less than 200 ha. Other areas of significant vegetation have not been sampled adequately or consistently.
It is totally unsatisfactory to be asking the public to comment on such inadequate information, especially when dealing with endangered ecological communities.
2. The proposed zoning map does not reflect the described development or the stated purpose to conserve native vegetation
The higher density six storey buildings are planned to be built closest to the bushland but they are zoned R3 (medium density). It should be zoned R4, high density residential.
There are also inconsistencies in the minimum lot sizes of 125 m2 and 225 m2 stated in different parts of the proposal documents. The prospect of lot sizes of 125 m2 is alarming! No room for trees.
Most of the riparian areas are described as having high conservation significance so should be zoned as E2. However the proposed zoning is RE1. It appears the intention is to allow a gravity feed sewer to be installed along the creek lines, hardly compatible with conservation. Construction of a sewer would need road access that would damage the natural creek line and, on past experience, create a wide band of weed invasion.
3. Large areas of the zoning proposal are deferred
The deferred areas are the main bushland strips that interface between the residential areas and the core riparian areas. They cover a significant part of the bushland. The reason given is the uncertainty of the biodiversity legislation that had not been passed when the proposal was submitted.
These deferred areas will be hard to manage because of the proximity to the housing development so government agencies will probably not want them.
An absolute tragedy would occur if they were traded for biobanking sites elsewhere as it would be impossible to find equivalent vegetation communities to be restored to offset the losses. They should become areas that are off-limits to biobanking.
The effect of this proposal on the existing vegetation will be very damaging unless very detailed precinct plans to protect it are drawn up and very active and expensive management takes place in perpetuity.
It is unsatisfactory to expect the public to comment on this proposal with incomplete and inadequate information.
Summary
Ideally STEP would like this parcel of land to remain rural, but in the event of it being rezoned for residential development STEP would like the potential impact on biodiversity reduced. Possible mechanisms for this include:
- The RE1 zoning changed to E2 to allow better management of the biodiversity values
- The deferred areas to be zoned E2
- The areas zoned E2 to be managed by the local council with the provision of funding for long-term management from the developer
- The area currently proposed for R3 (medium density) should be greatly reduced with a zoning of R2 (low density) in areas with scattered trees
- Very limited R4 (high density) set well back from the bushland
- The minimum lot size for dwelling houses and semi-detached houses increased well above 225 m2, preferably up to 500 m2
- Find an alternative to gravity-fed sewers down the creeks
- Development set further back from the areas of biodiversity constraints so that the bushland edges are not as severely impacted
- Provision of buffering by revegetation should be considered along bushland edges
Hawkesbury Sandstone Shale Lenses
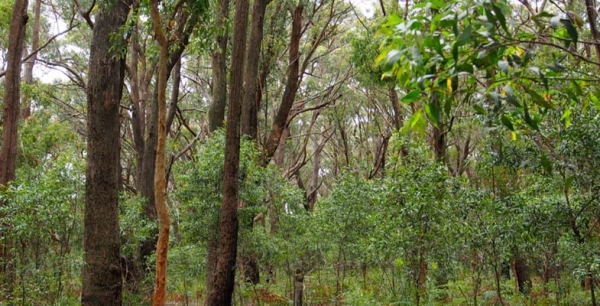
Most people who live in the upper North Shore and who are interested in bushland, or gardening, or geology, or maybe all three, would be conscious of whether they live on ‘shales’ or ‘sandstones’. They might also be aware that the shales generally overlie the sandstones, or so it would seem. But I had a conversation once with a lady who lives at Duffys Forest who believed that she and her neighbours lived on ‘Wianamatta Shales’. Well it was a reasonable assumption – but incorrect!
The shales that were once extensively quarried at Duffys belong to a thick lens some 140 to 170 m above the base of the Hawkesbury Sandstone, and at these levels and geologic times, the meandering, braided river channels that deposited the sands were starting to pond, and flood plain lagoons became more extensive and persisted for longer, accumulating clays that were preserved beneath further layers of river sand; or torn up and redeposited as sand with shards of shale. Eventually the sand was washed down only in intermittent flood bursts; its sand bars invading the muddy lagoons and the sands interlayering with the clays and silts, creating the transitional Mittagong Formation. The clays then took over as the river basin became a swampy, Triassic coastal lowland, and the Wianamatta Group was formed, but more about Mittagong and Wianamatta in later articles.
Shale Lenses: Form and Size
Hawkesbury Sandstone shale lenses lie sometimes only a few tens of metres or less below the stratigraphic top of the sandstone and they have been mapped and interpreted in different ways over the years. Without drill data it can often be difficult for a field geologist to know if scrappy, lateritised shale floaters and outcrops on a ridgetop are lying within or on top of the sandstone. As such, they were mapped sometimes as outliers of Wianamatta Group or Mittagong Formation, but latterly they have tended to be pushed down into the sandstones. A good example of such ambiguity would be the lateritised shale ridge capping at St Ives Showground, whose topographic setting could fit it into either category. Not only do such shale lenses tend to increase in frequency upwards in the sandstone sequence, but they are more common northwards and towards the coast.
Most lenses are just oversized slivers less than a metre thick and tens to hundreds of metres in lateral extent, and they tend most commonly to consist of laminite: a thinly bedded (mm to cm) alternation of shale, siltstone and sandstone. If you're out and about there are several places you can see them such as the south wall of the Argyle Cut in the Rocks. And on the M2 at Barclay Road overbridge, North Rocks, the NorthConnex guys are excavating a sandstone face with a laminite lens, though this may well soon be concreted over. There's a great example on the cliff top north of Wattamolla, and then there's Beacon Hill, just off Warringah Road, where shale once quarried for ceramics is still visible at the base of the hillside flanking the sports oval. This lens is more substantial and actually yielded numerous fish fossils of freshwater affinity.
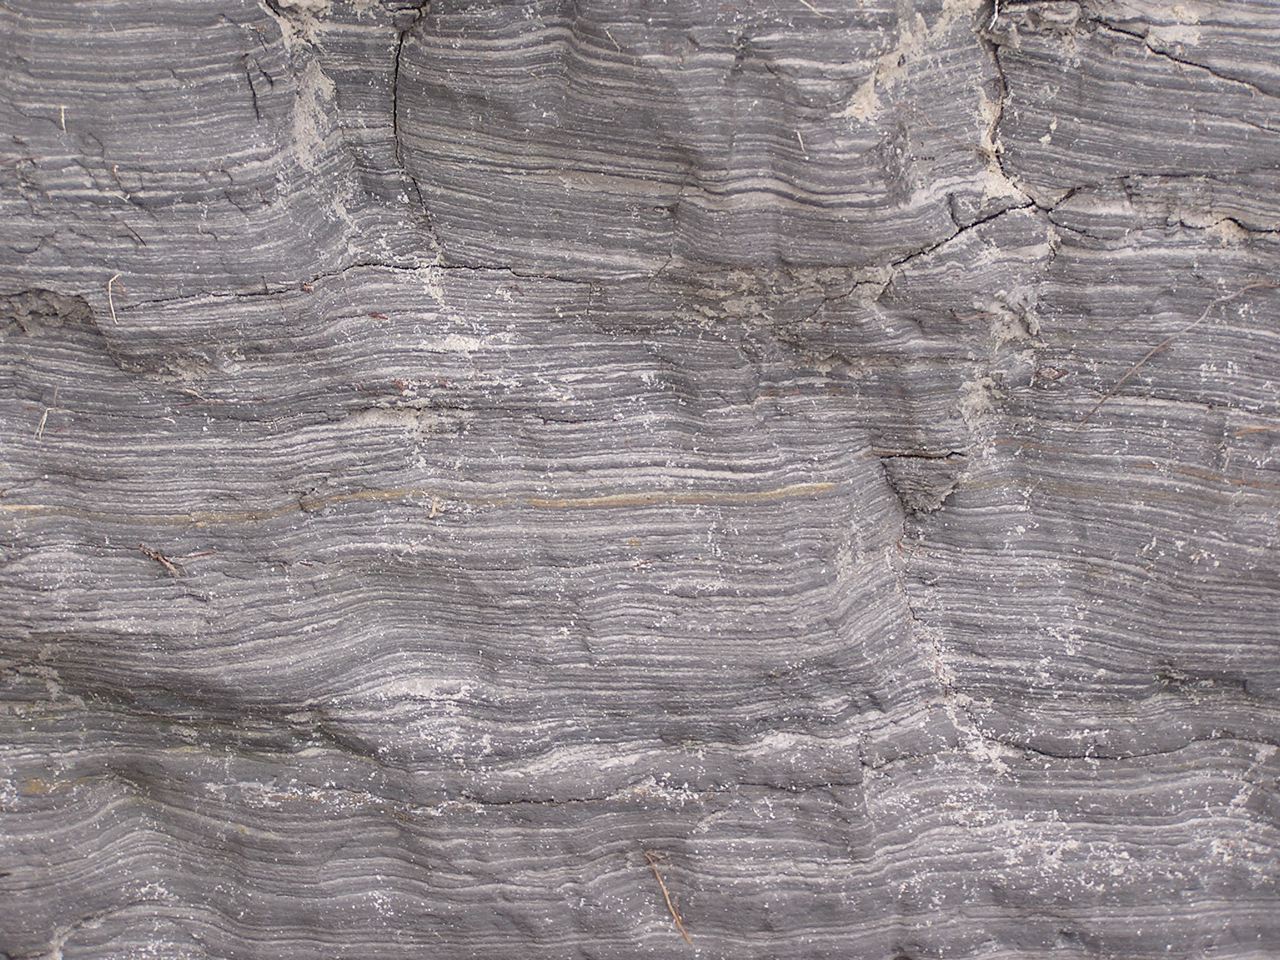
Laminite – millimetre-thick alternating layers of sandstone and shale, Wattamolla cliff top
The Beacon Hill shale lens is thick, but not as thick as the Duffys Forest lens which was 35 m thick before quarrying. Thick also was a lens at Lucas Heights which is of the order of 10 to 20 m. Substantial lenses also occur at Canoelands, Kirrawee, Menai and Darkes Forest, and most of these larger ones tend to carry shale and mudstone in addition to laminite. There is a very readable account published on-line by ANSTO of the Little Forest lens at Lucas Heights, in which the author found little difference between its shale and typical Ashfield Shale of the overlying Wianamatta Group.
In terms of area, the larger lenses may originally have covered several square km, though because they were formed in lagoons and oxbows there is a tendency for them to appear long and narrow. The Darkes Forest lens for example extends along its ridgetop for nearly 4 km and the Duffys Forest lens measures 3 km in outcrop from north to south.
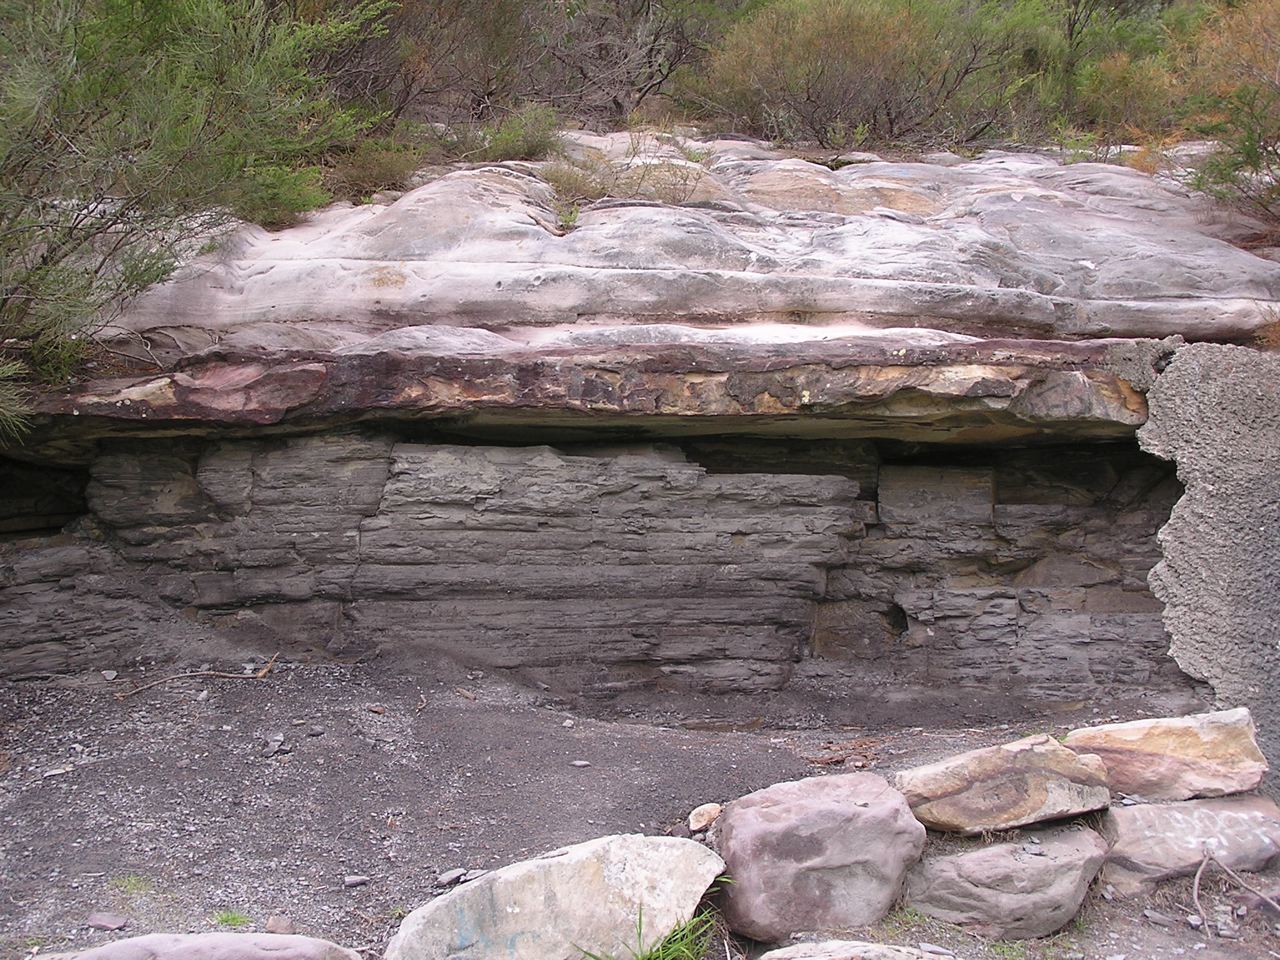
Shale/mudstone overlain by sandstone in former wall of Beacon Hill Quarry
Shale Lenses and their Vegetation
The shale lenses have a marked effect on soils, and this is reflected of course in the vegetation. Shale soils being more fertile have often been cleared for orchards and smallholdings, as at Darkes Forest and Canoelands, though there are significant surviving natural vegetation remnants, as described below.
Darkes Forest
I first stumbled on Darkes Forest by following the signs to the orchards from the Princes Highway, and was surprised to drive past quite tall forests of straight trunked trees; quite a contrast to the sandstone woodlands and shrublands along the highway. The forests are catchment protected so it's unwise to venture too far in, but it's easy to distinguish White Stringybarks, Sydney Peppermints and Sydney Red Gums shading an open floor peppered with tall shrubs of Two-veined Hickory Acacia binervata and a variety of other species including Gymea Lilies. About 200 ha of this forest remains, and has been declared as O'Hares Creek Shale Forest community and listed as endangered. See photo at the top of the page.
Menai
You may drive past the 5 ha Halls Drive Bushland Reserve off New Illawarra Road without noticing it, and be unaware there is any shale in the area, but venture in and you'll see shale fragments in the soil and be confronted with several species of eucalypts of both shale and sandstone affinity. It's probable both White and Common Sandstone Stringybarks are present as are Red Mahoganies, and these are accompanied by Sydney Red Gums and scribbly gums (unsure of species). The last two are perfectly at home on sandstone, but there are also abundant Blackthorns Bursaria spinosa – shrubs more typical of shale terrain. The plant community falls within the broad embrace of the critically endangered Shale Sandstone Transition Forest community.
Kirrawee
The 1:100,000 scale published geology map shows a chain of shale bodies running for 10 km along the ridge line between Sutherland and Cronulla. These are almost entirely built over except for some tiny patches of bushland adjoining Kirrawee railway station. These feature grassy woodland dominated by Grey Ironbarks and are a good example of Sydney Turpentine Ironbark Forest.
Beacon Hill–Frenchs Forest
The only surviving bushland on Beacon Hill itself is totally on sandstone not the shale of the former quarry, but shale lenses mapped around Frenchs Forest nearby carry surviving forest and woodland, though this has been under recent threat from hospital and road construction. A tree that can still be found there is White Mahogany Eucalyptus acmenoides, a shale-loving northern species also common in Edna Hunt Sanctuary near Epping, both areas at the southern limit of its natural range.
Duffys Forest
This semi-rural ridgetop settlement spreads across sandstone and shale, extending over the old shale quarry which has been manicured into a housing estate, country club and golf course. Much of the shale-related bushland was lost in the quarrying but some survives on its north-east and south-west sides. Whether it's truly Duffys Forest plant community may depend on interpretation, as key Duffys species such as Brown Stringybark Eucalyptus capitellata and Caley's Grevillea Grevillea caleyi are either absent or extremely hard to find there.
Trees that can be found include common species like Red Bloodwood, Silvertop Ash, Common Sandstone Stringybark, Sydney Red Gum and Christmas Bush, with a scattering of Blackbutts and Turpentines. The tree flora has affinities with both Duffys Forest and Shale Sandstone Transition Forest communities.
The shale is heavily lateritised, and iron-rich laterite debris have accumulated downslope on sandstone benches and in hollows. Among the species supported in such sites are a wealth of Proteaceae including Waratahs.
Berowra
When you walk from Berowra to Berowra Waters you descend to a firetrail that follows the contour. The hillside here has flattened into a broad bench and there are numerous shale and siltstone fragments in the soil. A shale band has created an aquiclude, wetting the soil to support abundant Umbrella Fern groves, plus thickets of the green-flowered Grevillea mucronulata; not a common plant on the North Shore but very abundant here. The Berowra example is a departure from the ridgetop shale settings and threatened, shale-related plant communities, and if any threatened community is represented there it is Coastal Upland Swamp.
Canoelands
The name of this locality is said to derive from timber getters finding stringybark ‘canoe trees’ with scars from bark removal. The stringybark was said to be Eucalyptus cephalocarpa but there are no known localities of this species north of Merimbula. The few hectares of bushland remnants among the Canoelands orchards carry tall straight stringybarks that are most likely E. globoidea. Such remnants have been mapped as critically endangered Turpentine Ironbark Forest in Hornsby Council's surveys.
This is the second in a series of articles by John Martyn on Sydney’s geology. Click here for his article on the Narrabeen Group.
BioBanking Activity in Sheldon Forest
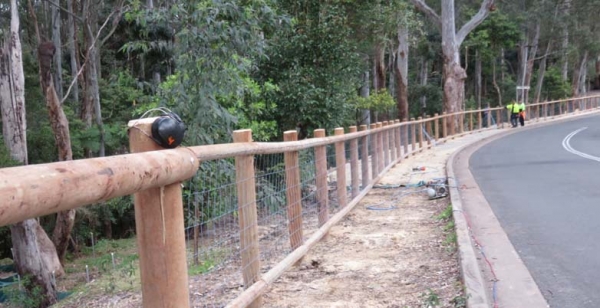
Sheldon Forest in Turramurra contains the second largest area remaining of the critically endangered Blue Gum High Forest covering an area of 5.4 ha. Sheldon Forest is linked to Rofe Park and Comenarra Creek Reserve so that the bushland extends from the railway line at Turramurra to Lane Cove National Park and provides an essential wildlife corridor that can potentially link Lane Cove National Park to Ku-ring-gai Chase National Park. It has been degraded over the years from fill from Warragal Rd and the rail cutting, weed invasion, storm water erosion, and waterlogging, feral animals, rubbish dumping and suburban encroachment.
In 2014 Ku-ring-gai Council signed a BioBanking Agreement with the NSW government under the Linking Landscapes through Local Action grant program. Council agreed to improve the reserves’ biodiversity values by undertaking management actions. These actions will create biodiversity credits and in return council has received grant funding.
Note: In many BioBanking schemes a developer purchases the credits and the money is used to restore a vegetation community elsewhere to make up for the loss caused by the development – see NSW Offsets Policy: A Dubious Way to Prevent Loss of Biodiversity (STEP Matters, Issue 181).
The BioBanking Agreement establishes a fund of $1.6 million that provides an ongoing, annual income to council to manage the bushland. The fund will give council annual management payments of between $100,000 and $130,000 for the first 20 years of the agreement, and thereafter about $40,000 each year in perpetuity. Council will contribute an additional $469,000 over three years to help manage the sites.
Action so Far
Anyone driving down Warragal Road, Turramurra just over the railway line will have noticed a lot of activity. Council has given us information on the works completed or in progress:
- In 2014 a sediment basin was constructed near the railway line and a large amount of ‘foreign’ soil was removed that had been dumped when the railway line was constructed. Creek stabilisation works were completed that were designed to encourage natural revegetation.
- Weed removal and preparation for ecological burns near Albion and Jubilee Avenues.
- Weed removal and stabilisation along Warragal Road.
- The revegetation of approximately 1800 m2 of Blue Gum High Forest using appropriate species and densities.
- Extensive fencing, both temporary and permanent, to assist with stabilisation and regeneration after the weed removal.
There will be much more work to do to ensure the permanent restoration of the native vegetation so that the weeds do not take over again.
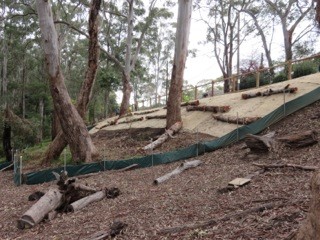 It should be noted that the sloping land adjoining Warragal Road is part of the council road reserve and is fill. As such it should be managed as a buffer to the Blue Gum High Forest in Sheldon Forest. The boundary between the two should be clearly delineated so that any erosion from the slope is managed and does not degrade the forest soil.
The stormwater outlet from Warragal Road discharging directly into Sheldon Forest is also a concern as it will have an impact on the viability of Blue Gum High Forest species in the affected areas. In the long term this stormwater should be redirected to an alternative sub-catchment.
The permanent fencing along Warragal Road is receiving a lot of comment. It is meant to be ‘non-intrusive’. Maybe it will weather to a natural colour?
Outcome of the Federal Election Bad for Climate Change Research and Action
Well the July election is done and dusted and the Liberal–National Coalition just scraped in. Despite Malcolm Turnbull’s previous statements about the need for serious action on climate change it appears that he does not have the political will to overturn past government decisions to downgrade climate change research and development.
CSIRO Cuts
CSIRO is an organisation independent from the government but still very much dependent on government funding. In February the CEO announced that climate science is settled so the focus can change to adaptation and mitigation. This statement was used to justify cutting over 100 climate change research jobs. Funding could be diverted to fields that could be more lucrative.
The size of the cuts was modified following an international outcry but there was still a cut of about 75 positions from the Oceans and Atmosphere division. Research is to be centred in Hobart in a new Climate Science Centre that will coordinate the work of 40 scientists carved out of existing CSIRO teams, and also tap into work by the Bureau of Meteorology and universities.
In August another modification was made when new Science Minister, Greg Hunt, ordered CSIRO to revive some other climate science programs in climate analysis and forecasting in Hobart. But these jobs will be financed out of the existing budget.
Fundamentally we still have less climate science capacity than before the cuts were announced. Some outstanding scientists with a huge accumulation of knowledge such as John Church, global sea level expert, will not return.
Support for Renewable Energy
There are plans to cut most of the funding for Australian Renewable Energy Agency as well as its ability to give grants. As the world responds to the urgent need to build new renewable electricity generation capacity, this plan is puzzling. Again the government’s reason is long-term ‘budget repair’. Australia has a long history of leading research into new solar technology. Hundreds of jobs will be lost from current research organisations and the potential opportunities for future commercialisation.
These policies conflict with the plans to help Australia become an innovation nation. The message from the government is that research is an expensive luxury rather an essential part of our long-term future.
We Need to Fight to Keep our Urban Forests

NSW residents are currently waiting for the state government to respond to the deluge of submissions opposing the new draft biodiversity and land clearing laws. The application of this legislation to Sydney’s bushland is unknown at present.
Urban Forests
Essentially there is a conflict between the need to accommodate the expectation of continuing high population growth and the desire to maintain a desirable city to live in. The high population growth is totally undesirable but we have had plenty to say about that before.
Now turning to the ideal of having liveable cities, one of the major elements is adequate tree cover. This is not impossible to achieve if there is the political will to get the planning right. Given the attitudes of the current NSW government to trees, residents will need to make it loud and clear that they will not accept a continuation of current policies.
In North Sydney Council’s Urban Forest Strategy document 2011, urban forest is defined as:
… the totality of trees and shrubs on all public and private land in and around urban areas and is measured as a canopy cover percentage of the total area. The canopy cover may vary in density depending on the vegetation type (eg almost solid cover under rainforest vegetation to more open cover under woodland or eucalypt forests) however the canopy cover percentage for urban forest measurement purely measures the percentage of land that has tree or shrub vegetation (over 3 m tall) above it, regardless of density.
Benefits of Urban Forests
Reduction in the Urban Heat Island Effect
Heat from the atmosphere is used in vegetation transpiration processes which convert water from leaves to water vapour. This has a cooling effect similar to that when humans perspire. Trees can transpire significant volumes of water and it has been estimated that a mature tree can transpire up to 150 L/day. In a hot dry location this produces a cooling effect similar to that of two air conditioners running for 20 h.
Much of the urban landscape is paved and devoid of vegetation. This means that there is usually little water available for evaporation, so most available natural energy is used to warm surfaces. Construction materials are dense, and many – particularly dark-coloured surfaces like asphalt – are good at absorbing and storing solar radiation.
Trees are a very effective means of blocking the sun’s radiation and, depending on the species and its maturity, up to 95% of the incoming radiation can be blocked. Trees can reduce a building’s temperature by directly blocking radiation through windows and cooling the surrounding air, and can also keep the soil cool thus providing a sink for heat from the building. These effects have been quantified as reducing air temperatures in built up areas by 1 to 5°C.
Reduction in Energy Demand
A typical adaptation response to the lack of external cooling is reliance on air conditioning, which generates waste heat and contributes to greenhouse gas emissions. Studies in the US have indicated that 5 to 10% of electricity demand in cities is from air conditioners used to compensate urban heat island effects. Increases in peak energy demand drive up infrastructure costs and increase the risk of power cuts during heatwaves. Air conditioner use amounts to nearly one-third of the power consumed in Perth on the hottest days in February and March.
Other Benefits
- Reduction in water run-off and erosion during storm events
- Improvement in water quality as the slowing of water run-off allows particulate matter to precipitate out and not pollute waterways
- Wind mitigation
- Improvement in air quality by absorbing gaseous pollutants and trapping particulate matter on their leaves
- Storage of carbon
- Reduction in noise pollution
- Shade for parked cars and outdoor pursuits
- Visual amenity and privacy
- Improved property values
- Attraction of birds and habitat for other wildlife
Recommended Canopy Cover
There have been many international studies of recommended canopy cover targets for urban forest. For example, according to the North Sydney report, for this climatic zone the recommended percentages for specific land-use areas are:
- 15% cover in central business districts
- 25% cover in medium and high density residential areas
- 50% cover in low density residential areas
Many cities now have urban forest targets in place, for example:
- Sydney city aims to increase urban forest cover (including private land) by 50% by 2030 and 75% by 2050
- Melbourne aims to increase canopy cover from 22 to 40% by 2040
- London aims to increase urban tree cover from the current 25% to 32% by 2065
- In 2015 New York City achieved a goal of planting one million trees to increase its urban forest by 20%
- Australian government has pledged to develop decade-by-decade goals out to 2050 for increased overall tree coverage
In 2014 the Institute for Sustainable Futures documented the tree cover in various parts of Sydney: Hornsby (59%), Ku-ring-gai (52%), Blacktown (19%), Parramatta (23%), City of Sydney (15%) and Rockdale (12%).
The figures for Hornsby and Ku-ring-gai are distorted by the inclusion of national parks that can provide some regional benefits such as improved air quality and cooling breezes if the wind is blowing in the right direction. However they do not provide the same benefits associated with trees in the immediate vicinity.
Stumbling Blocks
There are many barriers to achieving and maintaining urban forest. Generally the larger the trees the more effective are the benefits listed above. However there is a cost with managing larger trees. Trees ultimately need to be replaced when they reach their useful life expectancy. In an urban environment one cannot allow trees to reach the age where they become dangerous. There is also the need to achieve access for solar panels.
Developers will argue that the land is worth much more if it is built on. As we have seen all too often in Sydney, house blocks that had room for gardens, now have high and medium density housing with minimal, if any, tree cover remaining. SEPP65, the planning policy for high-rise is supposed to provide for deep soil planting but it does not seem to be enforced.
SEPP65, the planning policy for apartments covering all of NSW, now has a minimum deep soil requirement of only 7% of site area (Apartment Design Guide, p61). This is totally inadequate for a high rainfall area such as the North Shore where the native trees can reach heights of 30 m or more. Ku-ring-gai Council requires a minimum 50% site area for deep soil landscaping on sites over 1800 m2. This should be maintained and not over-ridden by SEPP65 Apartment Design Guide requirements.
Tiny backyards in new fringe areas and boundary-to-boundary development of new houses in existing suburbs often eliminate private land’s potential contribution to the urban forest. This puts incredible pressure on the public realm to provide the urban forest on top of needing to meet demands for infrastructure.
Compact city land-use policies and urban forest policies need to work together to ensure that cities have high-quality built environments and extensive tree cover. These policies must set the overall goals and outline strategies to deliver on them for both public and private land.
Greater Sydney Commission

The Greater Sydney Commission has been created by NSW legislation with a brief to make Sydney more liveable, more productive and more environmentally sustainable.
Currently district plans are being developed that are intended to be a link between local planning (eg council LEPs) and longer term regional planning.
Draft district plans are to be released towards the end of this year at the same time as the government is finalising the biodiversity legislation. The Greater Sydney Commission is currently undertaking extensive consultation in order to identify and prioritise issues.
This is a crucial time for the general public of Sydney to tell our politicians that our bushland and urban trees are vital. The campaign to inform the public about these issues is being led by the Total Environment Centre.
Byles Creek Decision

The tremendous efforts of the local community have produced some beneficial outcomes.
Issue 185 of STEP Matters provided an update on the battle by residents of Beecroft and the Beecroft Cheltenham Civic Trust to save bushland from subdivision and development at 79–87 Malton Road. This bushland is the last remaining corridor along Byles Creek between Lane Cove National Park and Pennant Hills Park.
The matter was brought before a Land and Environment Court conciliation conference. However it was inevitable, the final court determination approved the sub-division.
The asset protection zone around the houses to be built will entail the loss of a lot of vegetation but not as much as originally expected. There are conditions requiring the Vegetation and Fauna Management Plans applicable to the asset protection zone to take measures to preserve threatened species such as Leptospernum deanei and a possible nesting site of the Gang-gang Cockatoo. Part of the site (Lot 6 of approximately 1 hectare) will be passed into council hands to be conserved as open space.
A develpoment application for neighbouring land at 77 Malton Road (approx 7000 m2) has also been approved. Unfortunately, 77 trees will be lost for bushfire protection and construction. The owners are prepared to work with council to come to an agreement over the walking track along Byles Creek that will allow the public access to Byles Creek Valley and Lane Cove National Park.
Flooding Wilderness, Wild Rivers and World Heritage

Two weeks before the Federal election with Warragamba Dam threatening to spill due to severe storms, the Baird government committed to raising the dam wall to prevent potential flood impacts on marginally held seats in western Sydney. Perhaps for the same reason, NSW Labor reversed its ‘don’t raise the dam’ position and supported the proposal. However, no new information was released to justify this decision. The economic case and environmental impact statement for such a major project are years away, so it seems to be another case of decision now, judgement later for NSW.
This is not a new proposal. A similar scheme was defeated in 1995 following a strong campaign by the Kowmung Committee led by Andrew Cox, after the Greiner–Fahey government had committed to raising the wall in 1993. The subsequent Carr government then approved construction of a large spillway beside the dam, completed in 2002, to protect it from major floods.
In December 2012 the NSW government accepted a recommendation from Infrastructure NSW in its 20 year State Infrastructure Strategy:
to review all major flood mitigation options available, including raising the Warragamba Dam wall, to significantly reduce the potential economic and social impact of flooding in the Hawkesbury Nepean Valley
This report was overseen by chief executive officer, and former Sydney Water head, Paul Broad, and ex-premier and chairperson of Infrastructure NSW, Nick Greiner. To them the dam was unfinished business.
Raising Warragamba Dam’s wall will inundate over 3,000 hectares of World Heritage listed national park lands, wilderness and wild rivers. Lower reaches of protected wild rivers, including the Kowmung, Coxs and Nattai Rivers, will be flooded. Temporary inundation caused by the proposal will scar wilderness areas, kill riverbank vegetation and deposit sediment. The affected parts of the southern Blue Mountains national parks, arguably the most protected parks in Australia, may have to be revoked, as they will be degraded if this scheme proceeds.
Temporary impoundment of floodwater will result in the ‘bath-ring effect’ – visual scarring of the landscape when natural areas are temporarily inundated. The NSW government would like us to believe that the drowned World Heritage Area will not be degraded, but once native vegetation is inundated and smothered in sediment, it becomes replaced by an eroding mess of bare earth and weeds.
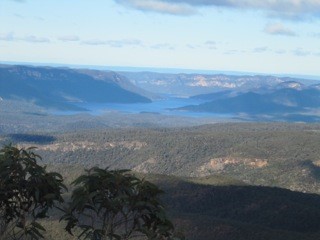 Views from McMahons Lookout, Splendour Rock, Burragorang Lookout and many others in the Blue Breaks will be ghastly. Lake Burragorang will have a much expanded ‘bath-ring’ and may also gain an enlarged Schedule One area further up the Coxs River, interfering with Katoomba to Kanangra walks, spoiling or placing off limits favoured campsites.
The Camden White Gum forests in the Kedumba Valley, listed as vulnerable under Commonwealth environment laws, will also be lost when flooded.
The Blue Mountains Conservation Society is opposed to the development. Vice-president Tara Cameron said:
We are very concerned that between Badgerys Creek airport and raising the Warragamba Dam wall, the world heritage values of the Blue Mountains will be deemed at risk by UNESCO. Australia has an international obligation to protect these areas not destroy them. This is an environmental disaster
(BM Gazette, 20 June 2016).
Developer Benefits
Former National Parks Association CEO, Andrew Cox, now with 4Nature, believes that the proposal may put more people at risk of flooding, not less. ‘We’re worried that by raising the dam and providing some level of protection it will actually trigger development on the flood plain,’ Mr Cox said.
Western Sydney Leadership Council chairman, Christopher Brown, has already flagged developing flood-prone land as a potential funding source for the dam wall extension.
‘I think there’s the capacity to use a value-capture funding method to reduce the impact on taxpayers,’ he said.
‘Maybe via a levy on land release that was previously considered flood-prone so we might be able to do it at a cheaper rate than what the government’s talking about.’ He suggested the wall extension could potentially be made higher than 14 m if such a levy was charged (Sarah Gerathy, ABC News, 17 June 2016).
Removing planning restrictions to develop flood prone areas will be highly profitable for some, but will endanger lives. In fact much of the North West Growth Centre around Riverstone is significantly affected by flood prone land. Residential areas are nevertheless planned within the maximum possible flood zone despite the acknowledgement that the enlarged dam will have no effect on extreme floods.
Flooding associated with the Upper Nepean which recently inundated Picton, as well as floods coming down the Grose, Colo and Macdonald rivers are not mitigated by the proposed dam wall raising.
Solutions
The best way to reduce the impacts of flooding on people is to relocate low-lying homes and avoid further building in flood prone areas. Floodplains are for floods and the proposed higher dam wall does not alter that fact.
Given Sydney Water’s new capacity to access water from the lower levels of Warragamba Dam, and the water security provided by the desalination plant, a less damaging solution would be to reduce the dam’s full storage level by a third and allow that proportion to be used for flood storage. The dam’s hydroelectric plant could be refurbished and then operate to lower the stored water to desired levels following a flood, while generating electricity for the national grid.
Efficient use of existing dam capacity, along with better flood planning and emergency response will save lives and the World Heritage area from an unnecessary $700 million dollar dam project and its contingent real estate development boom on the floodplain.
This article was written by Keith Muir. It was originally published in the Colong Foundation for Wilderness Bulletin, August 2016 edition. Reprinted with permission.
It’s Time to Declare Feral Deer a Pest

In the 19th century deer were imported and released into areas like Royal National Park because they were regarded as useful (for food and sport) and beautiful animals. Now their numbers have exploded.
At the request of the premier, the NSW Natural Resources Commission (NRC) has completed a pest animals management review. They released a draft report early this year and held public hearings around the state and received of over 600 submissions. Its final report and recommendations were submitted to the premier in August. The review found that pest animals cause considerable stress in communities:
It’s hard to measure, but even conservative estimates indicate NSW farmers spend around $22 million to manage pest animals per year, while the total annual economic impact of pest animals in NSW is conservatively estimated to be $170 million. Pest animals also affect 40% of all listed threatened species.
The findings cover pests that have long been causing problems for landholders such as wild dogs, pigs, foxes and rabbits, but they now also recognise that deer are a major cause for concern. For years feral deer have been allowed to run wild in NSW with management aimed at keeping deer numbers high enough to be a game resource. As the report states:
We need to manage the risks and impacts from all invasive species and that means treating feral deer and feral cats as pests just like wild pigs and dogs.
Therefore one recommendation made is that NSW government should:
- exclude all species of deer from the NSW Game and Feral Animal Control Act 2002
- include all species of feral deer in a regulation addressing pest animals under the NSW Biosecurity Act 2015
The Invasive Species Council is concerned that the powerful hunting lobby is determined to maintain the status quo. The Council is calling on people to contact the premier and the Minister for Primary Industries, Niall Blair and support the recommendations of the NRC in order to protect our natural environment from exploding feral deer numbers.
Here is a selection of facts supporting the case for the declaration of feral deer as a pest species. They:
- are out of control throughout NSW
- have been declared by the NRC to be our 'most important emerging pest animal threat'
- are a menace on our roads – in the Illawarra region feral deer have caused nine fatalities in a seven year period and 100 collisions with trains
- can be found in most regions of NSW, threatening the Royal National Park and the Illawarra escarpment rainforests, Kosciuszko National Park, the coastal forests between Newcastle and Coffs Harbour and even woodlands and rangelands in the west
- damage fences, pastures and cropsand can spread weeds and diseases
- impact rainforests and forests
- limit regeneration by reducing seed production and seedling recruitment, heavily browse ferns and other plants and push open the forest understorey
- have already been declared a feral pest in Queensland, SA and WA
Towards a Richer Understanding of Local Geology

To many people who are fascinated by Sydney's native flora but have no formal training in geology, the rocks around and about are generally thought of, in simple terms, to consist either of sandstones, shales or volcanic rocks. To express this in a crude stratigraphic way there are believed to be Wianamatta shales lying above Hawkesbury Sandstone which in turn rests on Narrabeen shales. Plus there are the volcanic diatremes of course.
‘Narrabeen shales’ is a term you often hear and read especially when plant communities like Pittwater Spotted Gum Forest and coastal clay heath are described, even in the formal sense by qualified botanists, and generally refers to the Newport Formation. But this term grossly misrepresents the reality, so firstly let’s look at the Narrabeen Group in more detail.
The Narrabeen Group
This group has the widest distribution of any major suite of rocks in the Sydney Basin making up much of the Greater Blue Mountains and covering a vast swathe of the Central Coast and its hinterland. It reaches a maximum thickness of something like 800 m (by comparison, the Hawkesbury Sandstone reaches roughly 250 m in thickness). It could be argued that ‘Narrabeen’ is a poorly chosen type-locality name because, although the group is a collection of 21 distinct formations scattered across the basin, only two of them are present in full on the Northern Beaches, plus just an isolated seashore outcrop of a third one.
Local Formations of the Narrabeen Group
1. Bulgo Sandstone
The ‘isolated seashore outcrop’ is of the Bulgo Sandstone, the top 10 m of which just, but only just, breaks surface on the outer tip of Long Reef. However, out under the sea, deep drilling for the ocean sewage outfall passed through 200 m of Bulgo Sandstone.
Commonly a grey-green colour when fresh, the Bulgo Sandstone can carry, in addition to quartz, a high proportion of grains of volcanic rock of a type similar to those classic columnar-jointed lavas you see on the coast at Kiama; therefore it bears only passing resemblance to the (very quartz-rich) Hawkesbury Sandstone. You can see the Bulgo Sandstone in full at the southern end of the Royal towards Bulgo village where it forms a stunning cliff line; and its pebbly, more quartz-rich lower layers host the famous Figure 8 Pool.
The Bulgo Sandstone's volcanic sand grains break down under weathering to clays leading to the common misconception that the southern slopes of the Royal are over a shale sequence. These clay-rich soils are much deeper and more fertile than those developed over quartz sandstones, and also have inherited plant nutrients from the sandstone's volcanic component, which helps in their hosting of a diverse littoral rainforest community.
In the photo at the top of the page, facing the full brunt of the waves, the topmost 10 m of the Bulgo Sandstone emerges and protects the soft Bald Hill Claystone of the Long Reef rock platform from being washed away into the Tasman Sea.
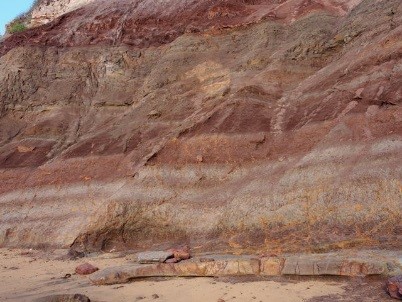 2. Bald Hill Claystone
Overlying the Bulgo Sandstone, the Bald Hill Claystone is a strange and remarkable rock by any standards. It's not a shale but the name ‘claystone’ means, like shale and mudstone, it's made largely of clay minerals. It's crumbly but only locally truly shaley.
Also, its kaolinite is stained a deep, dull red-brown (some say chocolate colour) by hematite which, like the kaolinite, was the result of recurrent contemporary weathering of layer upon layer of fine volcanic debris 248 million years ago in early Triassic times. You can see grey-green bands of sandy or gritty debris interlayered with reddish claystones in the cliff faces and platforms at Long Reef.
Bald Hill Claystone at Long Reef is also well known for its Triassic ‘paleosols’ – fossil soil profiles in which you can even recognise ancient root traces.
Red is the prominent colour of the Bald Hill Claystone but you will notice here at Long Reef that the red beds are interlayered with light coloured, greenish-grey bands made of sand grains derived from weathering of volcanic rocks.
In the Northern Beaches, the claystone only supports vegetation on Long Reef Point, though well to the south it's present below the Hawkesbury Sandstone cliffs of the Illawarra Escarpment from the Royal to at least as far as Fitzroy Falls: its formal type locality is actually Bald Hill at Stanwell Tops.
At Long Reef Point it hosts heathland, shrubland and Themeda Grassland, but with a major problem of invasive bitou bush.
3. Newport Formation
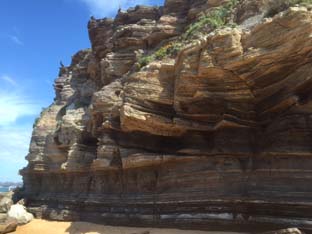
The Newport Formation rests above the Bald Hill Claystone via a transitional few metres of a curious, spotted volcanic ash deposit called the Garie Formation.
You can see a thinned version of the Newport Formation in the cliffs of North Garie Head in the Royal, then northwards it dips below the sea before surfacing low on the North Head cliffs – you can view its 15 m thick laminite and ledge-forming flaggy sandstones from the first lookout walking clockwise round the Fairfax Walk. However, it's much easier to see the formation in the cliffs from Narrabeen northwards where it consists mostly of thinly bedded sandstones and laminites with lenses of conglomerate (see photo).
Northwards along the coastline and across Pittwater into the Hawkesbury estuary there is a thickening and coarsening of the sandstones, and you can easily see this on Barrenjoey and Lion Island where only the topmost quarter of their thick sandstone cliffs belongs to the Hawkesbury Sandstone. You can often strain your eyes deciding where one formation finishes and the other begins, though the Newport sandstones tend to have dirtier, rustier weathering surfaces. The sandstones are impure quartz lithic ones and locally interbedded with laminites which are exposed especially north side of Lion Island where the formation has undergone a name change to Terrigal Formation.
The Newport Formation is host to some important plant communities. Its sandstones and laminites of the coastal cliffs weather to a stony, clay-rich soil which supports coastal clay heath and endangered Themeda Grassland. But traverse the peninsula and this all changes to pockets of littoral rainforest intermixed with endangered Pittwater Spotted Gum Forest. The host soils are weathered, thick quartz lithic sandstones with intermittent laminite layers – but definitely not shales.
Thick sandstones persist westwards and upstream into the Hawkesbury estuary but the tree species change, the principal eucalypt becoming Angophora floribunda comprising the Rough-barked Apple–Forest Oak Forest community defined by Smith & Smith in their plant survey projects for Hornsby and Warringah shire councils.
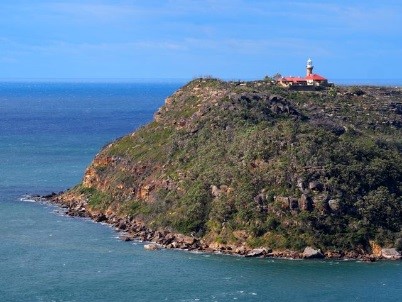
Barrenjoey lighthouse is built on a capping of Hawkesbury Sandstone but the lower two thirds of the headland is coarse-grained, rusty weathering sandstones of the Newport Formation which are the host rocks of the endangered Pittwater Spotted Gum Forest
This is the first in a series of articles by John Martyn describing his exploration of Sydney’s geology.
Heathlands: Walks and Wildflowers of the Ulladulla Headlands

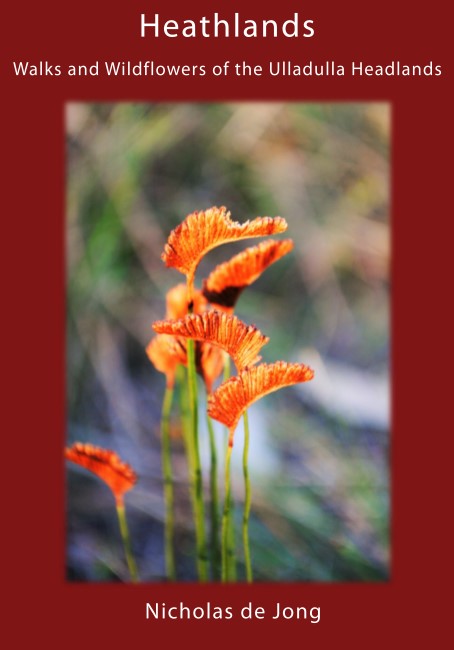 There is surprisingly little information that describes, interprets and records heathlands and its ecology in Australia. However, Nick de Jong’s book, which has more than 700 full-colour photos, goes a long way to addressing this gap in our knowledge.
Nick has recorded, identified, described and photographed more than 320 species of plants from Ulladulla’s coastal headland heathlands. The information he has collated showcases the areas species-rich native flora and it is presented in such a way that it will help you with plant identification.
Whilst the wildflowers form the heart of the book, Nick also describes ten coastal walks and discusses the evolutionary adaptations of the plants to wind, salt, fire and weed invasion. Many of these issues are the subject of current scientific study.
If you’re interested in coastal heathland plants, this book will be an important addition to your library.
- Describes 10 scenic coastal walks
- Identifies and describes 320 native plants and their flowering times
- Contains 700 full-colour photos
- Explains habitats, ecology and cultural history
- Identifies birds and butterflies
Cost: $45 ($35 + $10 postage)
To order, contactThis email address is being protected from spambots. You need JavaScript enabled to view it..
The House that Jack Built

 Back in the 1970s, a speck of harbourside bushland in Hunters Hill achieved unexpected fame as the site of the world’s first Green Ban when militant union leader Jack Mundey joined forces with local residents in what became known as the Battle for Kelly’s Bush.
Gordon Library is hosting an evening with James Colman, the author of a new book on the life of Jack Mundey.
Date: Tuesday 27 September
Venue: Gordon Library Meeting Room 1
Time: 6 to 7 pm
Cost: $5, wine and cheese will be served
Book: https://bookings.kmc.nsw.gov.au/coursesAndeventsTel: 9424 0120
After Kelly’s Bush, Mundey and his Builders Labourers’ Federation went on to save The Rocks and dozens of other well-known Sydney sites from the bulldozers. Across Australia, the green ban era saw many battles between residents, developers and officialdom – reaching a peak in the mid-70s. By this time its message had spread far and wide, and Mundey himself had become an international identity in the urban conservation movement.
The House that Jack Built is the first serious book on the man himself. Lane Cove author, architect and planner, Jim Colman, describes for the first time how Mundey moved from his early days as a young builder’s labourer from north Queensland to a leadership role in the Australian heritage movement.
And when the fervour of the green ban era had subsided, Mundey did not hang up his boots. He served a term as an alderman on the Sydney City Council and sat on the council of the Australian Conservation Foundation for a record term. Later he chaired the NSW Historic Houses Trust and in 1998 was named a national living treasure by the NSW National Trust. Amongst his many accolades are two honorary doctorates and an honorary master’s degree in environmental studies.
Colman’s book is a very readable, thoroughly researched and lavishly illustrated coverage of Mundey’s key achievements and activities in the planning and conservation fields during a busy half century. It reveals how this erstwhile communist and trade union leader became a dedicated conservationist who achieved fame – and notoriety – for exploits which were praised by the many, denounced by the few. And despite its evidence that we have made some solid progress in heritage conservation during the Mundey era, it concludes with a warning from the man himself:
The greatest single threat to the environment, locally as well as globally, is the rapacious greed of big multi-national corporations.
Rare Fungi

John Martyn discovered this beautiful pink fungus in Sheldon Forest.
Fungi expert Ray Kearney identified it as Cantharellus lilacinus. A wet weather rarity.
Hunting in National Parks

STEP was actively involved in the fight against the O’Farrell government’s legislation introduced in 2012 allowing amateur hunting in national parks, euphemistically called the Supplementary Pest Control Program.
Fortunately a strong public campaign of opposition and a damning report on the activity of the Game Council, the body slated to manage the hunting process, led to a complete rethink of the legislation (see STEP Matters Issue 172, p 5). Instead the government decided to trial over three years, a closely supervised volunteer ground shooting program in 12 national parks and state reserves, mostly in western NSW.
The evaluation of the program will ultimately assist the government in deciding whether, and if so, how, to proceed with supplementary pest control beyond the three year trial period.
In April 2016 the Natural Resources Commission reported in a media release on an interim review of the trial. It stated that the Supplementary Pest Control trial in national parks is building significant positive relationships among volunteers, neighbours, Aboriginal groups, and National Parks and Wildlife Service staff.
The media release stated that:
Both National Parks and Wildlife Service staff and the selected volunteers from the Sporting Shooters Association of Australia, NSW are working together very professionally, safely and with due regard to animal welfare …
An ongoing priority of the pest control trial will be to identify the specific set of circumstances where ground shooting using volunteers can be most useful to National Parks and Wildlife Service primary pest management program …
Overall the Commission found that the trial is being implemented in-line with relevant legislation and ministerial requirements, is meeting human safety and animal welfare requirements and that the efficiency and effectiveness of operations has improved.
In response to the Commission’s recommendations the NSW government has commenced night operations and committed to continuing to improve efficiency and effectiveness of the trial.
Common sense has prevailed. If only political expediency had not taken over when the first decision was made in 2012 to bend to the dangerous proposal by the Shooters and Fishers Party to allow amateur hunters into the majority of national parks.
Call for Nomination of Office Bearers and Committee Members

STEP welcomes new members of the committee and other members who would like to contribute to our work in some way. This work could involve publicity of events, updating our website, writing or researching submissions or whatever you can suggest.
Committee meetings are usually held on the first Wednesday of each month except January.
Our AGM is on 11 October 2016. Nominations for office bearers and committee members should be made in writing and received at least seven days before our AGM.
If you are interested in helping out, please send us an email and we will phone you back. Nomination forms are also available from This email address is being protected from spambots. You need JavaScript enabled to view it..
Are the Local Council Fit for the Future Reforms going too Far?

The NSW Government has been reforming the legislation governing the operation of local government under the catchy title of Fit for the Future reforms. The process started in late-2011 with the appointment of an independent local government review panel and a legislation taskforce. This process covers a lot more than the amalgamation issue.
One of the current stages (phase 1) of the reform program focuses mainly on changes to the governance and strategic business planning processes of councils. Later phases will focus on how councils raise revenue and how they exercise their regulatory functions, as well as a program of restructuring and updating the local government legislation.
A quick Google search reveals significant concerns about the current phase of the process. The Law Society and the Office of Local Government are two bodies that have expressed concern in their submissions that insufficient information is available about proposed legislation changes for a meaningful consultation to take place. The timeframes are also unrealistic. As has occurred with the amalgamation process the objective seems to be to rush through the changes so they can be implemented by about September 2016.
Many of the proposals go beyond STEP’s ambit of interest but the Ryde Hunters Hill Flora and Fauna Preservation Society has made a detailed submission that calls into question the intent of the whole process:
The Society considers that the proposed changes represent a more radical re-write of the role and purpose of local government in NSW than that of the amalgamation process. It would seem that the amalgamation debate process has exhausted and diverted local communities and their elected councillors from the legislative review.
It has distracted attention from these proposed legislative changes which will have a profound impact on the integrity of local government as a tier of government as most NSW residents understand it. In its overall intent phase 1 proposed changes could be interpreted as a cynical attempt by the State government to remove the autonomy of local government in decision-making and centralise power at a state level of government.
State of Environment Reporting
Under the current Local Government Act councils are required to include a State of the Environment Report in their annual report every four years. One particular issue raised by the Ryde Hunters Hill Flora and Fauna Preservation Society about the recent explanatory paper is the proposal to remove this requirement. Instead councils would be required to report on environmental issues relevant to the objectives established by the ‘community strategic plan’. At this stage it is not certain that there will be any provisions for the community strategic plan objectives to include environmental issues so a council would not need to budget to fund and report on environmental measures.
According to the explanatory paper this amendment is designed:
to reduce the compliance burden on councils arising from the preparation of a separate state of the environment report every four years.
It is unclear whether the reporting in the community strategic plan will relate to the council operations only and not measure aspects relating to all the residents of the council area. It is more appropriate to cover this sort of detail in a later stage of the review process.
This proposal has received very little publicity so it slipped through our radar.
State of the Environment (SoE) reporting is an essential requirement for understanding the incremental changes that are happening to our environment as the population juggernaut continues to invade Sydney. SoE reports provide a consistent and efficient framework for on-going environmental monitoring and reporting and necessitate timely appraisal of how councils are meeting vital goals. They provide a mechanism to feed into regional environmental planning processes. The information gathered can be integrated into council’s operational and strategic planning processes. This ensures that councils meet their responsibilities as natural resource managers.
NSROC SOE Report 2011–12
An example of the regional reporting is the Northern Sydney Regional Organisation of Councils (NSROC) combined report that provides a comprehensive snapshot. As the report states:
The Regional SoE Report allows NSROC communities … to have a broader understanding of water, air, biodiversity, waste, noise, heritage and planning issues and serves to enhance coordination between councils.
Here is a summary of some data from the 2011–12 report, the most recent available.
| Council | Hornsby | Ku-ring-gai | Ryde | Willoughby | North Sydney | Total |
| Approx population (thousands) | 164 | 114 | 106 | 71 | 65 | 567 |
| Residential energy (MWh/capita) | 2.8 | 3.61 | 2.58 | 2.75 | 2.92 | 2.99 |
| Water (kL per capita) | 80 | 88 | 98 | 114 | 107 | 98 |
| Waste to landfill (kg/capita) | 210 | 197 | 227 | 180 | 123 | 170 |
| Waste recycled (kg/capita) | 118 | 303 | 204 | 272 | 151 | 229 |
Bushcare volunteer hours have reduced from the previous year by 10% to 41,782. If these hours are valued at $25 per hour this equated to over $1million of free labour.
Residential energy consumption is going down, probably thanks to the solar panels on lots of roofs. Exported solar power in the region has grown from 219 MWh in 2007–8 to 15,473MWh in 2011–12.
Water consumption is reducing. But waste generation is a different story. The amount going to landfill continues to increase while there is also more being recycled.
There are some surprising variations in performance on a per capita basis between council areas which makes one wonder about the consistency of data definitions and/or collection methods.
Threats to Remove Tax Deductibility from Donations to Environment Groups Could Become a Reality

On 4 May 2016, the Senate Standing Committee on the Environment tabled a report on its inquiry into the Register of Environmental Organisations. Maybe it was hoped that with all the attention being given to the Budget, no one would notice.
The rhetoric from LNP politicians presaged the political agenda behind the inquiry such as the accusations by the Attorney General, George Brandis that environmental organisations (EOs) are destroying jobs. The implications were that the objective of the inquiry is to justify the removal of tax free donation status of environmental charities. The terms of reference for the enquiry related mainly to administrative aspects of the REO but included an examination of:
activities undertaken by organisations currently listed on the Register and the extent to which these activities involve on-ground environmental works
Under the Income Tax Assessment Act 1997 (Cth) an environmental organisation that is given Deductible Gift Recipient (DGR) status is required to have a principal purposeof:
- the protection and enhancement of the natural environment or of a significant aspect of the natural environment;or
- the provision of information or education, or the carrying on of research, about the natural environment or a significant aspect of the naturalenvironment.
Note the or above and yet the terms of reference focused on ‘on-ground’ works.
The inquiry received hundreds of submissions, held hearings and studied the activities of some EOs on the ground. They observed that:
Broadly speaking, the activities of environmental DGRs can be summarised under four categories:
- environmentalremediation
- education andresearch
- policy advocacy and representation
- other activities including those carried outoverseas
The committee acknowledged the significant and ongoing contribution of environmental charities to the protection and enhancement of the natural environmental in all states and territories. However the report stated that:
Having regard to the terms of reference of the inquiry, the committee is of the view that the purpose of granting DGR status to environmental organisations should be to support practical environmental work in the community.
They then have taken a very narrow interpretation of the meaning of ‘practical’. The significant recommendation is that:
… legislative and administrative changes be pursued by the Australian Taxation Office to require that the value of each environmental deductible gift recipient’s annual expenditure on environmental remediation work be no less than 25% of the organisation’s annual expenditure from its publicfund.
The committee accepted that definitional issues may arise from this recommendation. The committee’s view is that remediation work should include revegetation, wildlife rehabilitation, plant and animal pest control, land management and covenanting. Activities such as education, research, advocacy, legal services, activities involved in representing member organisations and activities carried out overseas should not qualify as remediation work.
The government report maintained that the recommended restriction would not impede the ability of EOs to carry our advocacy work.
The Labor Party senators published a dissenting viewpoint. Here are a few quotes from their report:
The overwhelming weight of evidence presented to the committee points to the vital importance of maintaining the tax deductibility of donations to environmental organisations, without imposing further conditions or constraints on the operation of those organisations.
Despite the efforts of government members, no disinterested evidence was adduced in support of the proposition that a distinction should be drawn between so-called ‘on ground’ environmental activities on the one hand, and advocacy, on the other.
In these circumstances, the Labor members of the committee find it extraordinary that government members have recommended to, in effect, constrain the capacity of environmental organisations to engage in advocacy work. We completely reject this undemocratic proposition. Citizens should be supported to question government decision-making and corporate power, not manoeuvred into silence by legislative and administrative action.
The dissenting report also pointed out that the recommendation would create additional red tape for both the environmental organisation and the Taxation Office in collecting information required to check that the organisations are complying with the requirement. Why should EOs be treated differently to other not-for-profit charities?
In STEP’s view it is totally unfair to propose such restrictions on the ability of EOs to raise funds while the corporate sector is free to lobby in their own interests and the expenditure incurred is tax deductible. EOs are acting in the interests of current and future generations to preserve a world that is being destroyed by government and corporate short term interests.
Example – longwall mining under Sydney’s water catchment – more longwalls would probably be approved by now if environment groups had not done such detailed research to highlight the issue. The authorities now recognise now serious the risks are of major loss of water flows and contamination.
STEP’s Environmental Protection Fund does have DGR status so we will need to review our position if and when any changes are made to the legislation.
Is Australia Winning?

Everyone likes a race; whether it’s the Melbourne Cup, some sporting event or an election. Winning is fabulous, losing can be character building.
Prosperity Index
There crossed my desk (iPad) the other day the Prosperity Index produced by the Legatum Institute based in London.
Table 1 gives a listing for 2015 of the top ten countries, the bottom ten (of 142) and for interest the United States and the United Kingdom.
The scoring is based on eight sub-indices. Australia’s ranking together with Norway (the overall winner) is shown in Table 2, together with the sub-index winners.
Table 1 Prosperity Index
| Country | Rank | Score |
| Norway | 1 | 3.50 |
| Switzerland | 2 | 3.34 |
| Denmark | 3 | 3.27 |
| New Zealand | 4 | 3.25 |
| Sweden | 5 | 3.22 |
| Canada | 6 | 3.19 |
| Australia | 7 | 3.09 |
| Netherlands | 8 | 3.05 |
| Finland | 9 | 3.01 |
| Ireland | 10 | 2.97 |
| United States | 11 | 2.93 |
| United Kingdom | 15 | 2.72 |
| Angola | 133 | (2.55) |
| Sudan | 134 | (2.55) |
| Yemen, Republic | 135 | (2.60) |
| Syrian Arab Republic | 136 | (2.61) |
| Congo, Democratic Republic | 137 | (2.66) |
| Burundi | 138 | (2.67) |
| Chad | 139 | (2.77) |
| Haiti | 140 | (2.82) |
| Afghanistan | 141 | (2.94) |
| Central African Republic | 142 | (3.55) |
Table 2 Prosperity sub-index rankings for Australia and Norway and overall winner
| Sub-index | Rank | Winner (rank 1) | |
| Australia | Norway | ||
| Economy | 12 | 4 | Singapore |
| Entrepreneurship and opportunity | 14 | 5 | Sweden |
| Governance | 10 | 8 | Switzerland |
| Education | 1 | 5 | Australia |
| Health | 15 | 4 | United States |
| Safety and security | 15 | 8 | Hong Kong SAR |
| Personal freedom | 9 | 3 | Canada |
| Social capital | 4 | 2 | New Zealand |
Look, we’ve won something; numero uno in education. Sorry to disappoint those of you in teaching but the sub-index is based on some statistical data like school attendance but without any reference to performance. More on this later.
Indeed I am not sure that education should have any place in this index. Education is all about future prosperity, not today’s.
One has to be sceptical that the United States is worthy of first place in health. This placing is almost certainly heavily influenced by expenditure per person which, for the United States, is more a reflection of high incomes for medicos rather than outcomes. The United States is the only OECD country without universal health care.
Drilling down into the detail is a fascinating yet frustrating experience. The economy sub-index doesn’t even include GDP per head or any other measure of income. The social capital sub-index is based totally on survey questions such as Donated money to charity in the past month? That is a meaningless question to ask simple villagers in a subsistence agricultural environment still common in the third world.
Human Development Index
Turning now to the United Nation’s Human Development Index Australia’s position looks much better (see Table 3).
Again, we are doing battle with Norway:and that country almost certainly wins because of the much higher gross national income due to North Sea oil. The data is for 2014; there has been a significant reduction in oil prices since.
Table 3 Human Development Index (HDI) 2014 rankings
| Country | Rank | HDI |
| Norway | 1 | 0.944 |
| Australia | 2 | 0.935 |
| Switzerland | 3 | 0.930 |
| Denmark | 4 | 0.923 |
| Netherlands | 5 | 0.922 |
| Germany | =6 | 0.916 |
| Ireland | =6 | 0.916 |
| United States | 8 | 0.915 |
| Canada | =9 | 0.913 |
| New Zealand | =9 | 0.913 |
| United Kingdom | 14 | 0.907 |
Strange is expected years of schooling (20.2 years for Australia and 17.5 years for Norway) which the United Nations says is:
The number of years of schooling that a child of school entrance age can expect to receive if prevailing patterns of age specific enrolment rates persist throughout the child’s life.
For this to be 20.2 years for Australia it looks like we are going to have most of the population between 20 and 25 studying for higher degrees at universities. This is ridiculous. It won’t happen.
Global Competitive Index
Now for a reality check. A very highly respected ranking is the World Economic Forum’s (Davos) Global Competitive Index.
Oh dear. We are a lowly 21st, even outranked by Malaysia (see Table 4). It must be made clear that this index is somewhat different to the others mentioned. From the report:
We define competitiveness as the set of institutions, policies, and factors that determine the level of productivity of a country. The level of productivity, in turn, sets the level of prosperity that can be reached by an economy.
My take on this is that it is attempting to measure things that determine prosperity, not prosperity itself.
The index has twelve pillars. Table 5 shows our rankings compared to the top three countries.
Table 4 Global Competitive Index 2015–16 rankings and 2014–15 comparisons
| Country | 2015–16 | 2014–15 | |
| Rank | Score | Rank | |
| Switzerland | 1 | 5.76 | 1 |
| Singapore | 2 | 5.68 | 2 |
| United States | 3 | 5.61 | 3 |
| Germany | 4 | 5.53 | 5 |
| Netherlands | 5 | 5.50 | 8 |
| Japan | 6 | 5.47 | 6 |
| Hong Kong SAR | 7 | 5.46 | 7 |
| Finland | 8 | 5.45 | 4 |
| Sweden | 9 | 5.43 | 10 |
| United Kingdom | 10 | 5.43 | 9 |
| Norway | 11 | 5.41 | 11 |
| Denmark | 12 | 5.32 | 13 |
| Canada | 13 | 5.31 | 15 |
| Qatar | 14 | 5.30 | 16 |
| Taiwan | 15 | 5.28 | 14 |
| New Zealand | 16 | 5.25 | 17 |
| United Arab Emirates | 17 | 5.24 | 12 |
| Malaysia | 18 | 5.23 | 20 |
| Belgium | 19 | 5.20 | 18 |
| Luxembourg | 20 | 5.20 | 19 |
| Australia | 21 | 5.15 | 22 |
Table 5 GCI 2015–16 comparison of rankings between Australia, Switzerland, Singapore and United States
| Pillars | Ranking | |||
| Australia | Switzerland | Singapore | United States | |
| 1 Institutions | 19 | 7 | 2 | 28 |
| 2 Infrastructure | 16 | 6 | 2 | 11 |
| 3 Macroeconomic environment | 28 | 6 | 12 | 96 |
| 4 Health and primary education | 9 | 11 | 2 | 46 |
| 5 Higher education and training | 8 | 4 | 1 | 6 |
| 6 Goods market efficiency | 27 | 9 | 1 | 16 |
| 7 Labour market efficiency | 36 | 1 | 2 | 4 |
| 8 Financial market development | 7 | 10 | 2 | 5 |
| 9 Technological readiness | 21 | 2 | 5 | 17 |
| 10 Market size | 22 | 39 | 35 | 2 |
| 11 Business sophistication | 27 | 1 | 18 | 4 |
| 12 Innovation | 23 | 1 | 9 | 4 |
Table 6 GCI 2015–16 comparison of macroeconomic environments between Australia, Switzerland, Singapore and United States
| 3rd pillar: Macroeconomic environment | Ranking | |||
| Australia | Switzerland | Singapore | United States | |
| 3.01 Government budget balance (% GDP) | 83 | 21 | 6 | 114 |
| 3.02 Gross national savings (% GDP) | 46 | 16 | 5 | 87 |
| 3.03 Inflation (annual % change) | 1 | 64 | 1 | 1 |
| 3.04 Government debt (% GDP) | 48 | 77 | 127 | 129 |
| 3.05 Country credit rating | not show | not show | not show | not show |
| Overall macroeconomic environment | 28 | 6 | 12 | 96 |
Questions, questions, questions – many could be asked. An enormous amount of data is available to drill down into.
To take one aspect. The United States rates well on market size but why should Switzerland and Singapore be marked down because they are small? They both have good access to enormous nearby markets and in this day and age of low freight costs having a small domestic market doesn’t matter all that much.
Contrary to Legatum’s Prosperity Index Australia does not rank so well on education. For the fifth pillar Singapore is first, followed by Finland. We do well on secondary enrolment but badly on quality of the education system and quality of math and science education.
The United States and ourselves rank poorly on macroeconomic environment (see Table 6).
Measuring some of these items is fraught with difficulty and weighting them in an index can only be quite subjective. Switzerland’s inflation rate in 2015–16 was negative which must account for its poor ranking.
Global Peace Index
Last of our rankings is the Global Peace Index. This has a world-wide reputation but is of special interest to Australians as it is the brainchild of Australian technology entrepreneur Steve Killelea.
Table 7 shows the 2015 rankings – the top ten, Norway, United Kingdom and the United States, and the bottom three.
The report provides a very useful commentary on trends. It is peculiar that the United Kingdom’s ranking should improve with the withdrawal of its troops from Afghanistan; surely their presence there was a contributor to peace.
One wonders how well correlated peace and prosperity are. Quite closely one would have thought as countries that are not prosperous are very prone to internal strife.
It’s a pity that downloadable data is not available for analysis. The report though contains much useful information.
No matter what our ranking by the pundits, Australia is a good place to live. We have generally pleasant weather and those wanting space in the form of suburban houses with some land can find it at reasonable prices (not true of Singapore, for instance) and still access work and all the amenities that a city typically offers within reasonable travel times. Whether that is environmentally sustainable is a matter for debate.
Table 7 Global Peace Index 2015
| Rank | Country | Score |
| 1 | Iceland | 1.148 |
| 2 | Denmark | 1.150 |
| 3 | Austria | 1.198 |
| 4 | New Zealand | 1.221 |
| 5 | Switzerland | 1.275 |
| 6 | Finland | 1.277 |
| 7 | Canada | 1.287 |
| 8 | Japan | 1.322 |
| 9 | Australia | 1.329 |
| 10 | Czech Republic | 1.341 |
| 17 | Norway | 1.393 |
| 39 | United Kingdom | 1.685 |
| 94 | United States | 2.038 |
| 160 | Afghanistan | 3.427 |
| 162 | Iraq | 3.444 |
| 163 | Syria | 3.645 |
By Jim Wells
So-called Biodiversity Reforms are not Fit for Purpose
The NSW government has been undertaking a major review of the biodiversity legislation in response to farmers’ complaints about the fairness and processes of the current land clearing laws. This has involved the appointment of an independent review panel whose report was released in December 2014. The report covered a lot more than rural land clearing laws and proposed a major revamp of the biodiversity protection provisions.
STEP Matters Issue 183 explained some of the concerns about the recommendations of the report, particularly the:
- use of self-assessment
- watering down of biodiversity offset standards
- reliance on private land conservation
- adequacy of provisions and resources to assess and monitor vegetation clearing
The recommendations, if adopted, would seriously undermine protections that currently limit development that is likely to lead to loss of biodiversity in rural and urban areas.
Prior to the 2015 election the NSW government promised to implement all recommendations of the report. Conservation groups have been calling on the general public to express their concerns to their local MPs in the hope that the actual legislation would recognise the issues raised but to no avail. The usual response was a standard email full of statements about the glorious improvement in biodiversity that was going to occur and made no acknowledgement of the concerns.
The Office of Environment and Heritage (OEH) set out to consult with key stakeholder groups such as the NPA and NCC on the drafting of the legislation. The process was such a sham that the groups withdrew from the process in February 2016. The groups issued this joint statement about the withdrawal:
We have provided detailed analysis and constructive feedback to help develop a conservation law that addresses the increasing threats to wildlife, soils and climate, but it is now clear that the government is on a course to pursue development at high environmental cost.
Direct talks with the relevant ministers also seem to have fallen on deaf ears.
On 6 May the draft legislation was released. The closing date for submissions was 28 June.
Application to Urban Areas and Tree Preservation Orders are still Unclear
Some aspects of the application of the legislation to urban areas are not yet clear. A new State Environmental Planning Policy and Development Control Plan for urban areas are yet to be released for consultation that will define the clearing controls and consent requirements. In fact it is not clear what consultation will occur.
Of particular concern is the proposal to replace individual council Tree Preservation Orders (TPOs) with a SEPP to apply to all urban areas. TPOs are an effective tool for protecting urban trees and their associated biodiversity, amenity, heritage, shade and heat reduction values. TPOs need to take into account differences in the characteristics of urban areas such as topography, existing canopy cover and proximity to bushland.
No clear justification for the proposed replacement of TPOs with a SEPP and the purported benefits of this approach has been provided. The Final Report from the Independent Biodiversity Legislation Review Panel does not address TPOs at all.
Response to Draft Legislation
A major campaign (Stand Up for Nature) was launched by a coalition of conservation groups to inform the public urging us to contact politicians to express opposition and ask for the legislation to be withdrawn. The campaign has been very successful. Over 5,400 submissions have been made opposing the legislation.
On top of this response, just last week a group of over 400 scientists released a declaration expressing concern about the current and likely future rate of deforestation and loss of habitat and its impact on threatened species.
The government wants to pass the legislation in October. They appear to be determined to ignore expert opinion. Future generations will face the consequences. Pressure needs to be maintained on the premier to modify the draft legislation.
Government Statements are Pure Spin
Here are three examples of the disconnect between the government’s statements on the OEH website about the reforms and the likely outcomes according to assessments by the Environmental Defenders Office (EDO), conservation groups and STEP.
Read EDO’s comprehensive analysis.
1. OEH statement on ecologically sustainable development (ESD)
The biodiversity reforms will facilitate ESD in NSW. The introduction of a new biodiversity offsets scheme, including the new Biodiversity Conservation Trust and an expanded biodiversity certification program will, for the first time, deliver a transparent, consistent and certain approach to biodiversity assessment and offsetting in NSW.
Comment
ESD is a basic objective of the current planning legislation. Its application in the past has led to genuine offsetting decisions such as the provision of funding for preservation of Blue Gum High Forest land in Browns Forest, St Ives to offset BGHF cleared for railway expansion in Hornsby.
Under this heading the OEH identifies the flawed biodiversity offset system as the means of facilitating ESD. The idea seems to be that merely making statements about ESD will make it happen. How can biodiversity be maintained or improved when a developer will be able to pay money into a fund if suitable vegetation for offsetting is not available.
The proposed reforms ignore the principles of ESD; they do not take a precautionary approach; they do not treat biodiversity conservation as a fundamental consideration in decision-making; and they are very unlikely to achieve intergenerational equity.
2. OEH statement that reforms will enhance biodiversity conservation on private land
Comment
The proposed regime places almost complete reliance on political, budgetary decisions (which may be short-term) to achieve biodiversity gains, rather than on protections to prevent continued biodiversity decline.
Who knows whether private landowners will be given sufficient long-term support to carry out conservation on their land?
Programs like the Saving our Species will fund measures to restore habitat for identified threatened species. But at the same time land clearing will be allowed that will destroy habitat for a lot more species. It is much more expensive to restore habitat than to preserve it in the first place.
3. OEH statement that the reforms will set and achieve clear biodiversity objectives
- The objects of the draft Bill emphasise conserving biodiversity and ecological integrity at bioregional and state scales and facilitating ecologically sustainable development.
- The draft Bill objects for improving and sharing knowledge about biodiversity, ecosystem services and conservation actions will be achieved through an environmental monitoring, assessment and reporting program to be established by OEH.
The reform package will deliver balanced legislation and positive outcomes for all stakeholders. Landholders will no longer be the sole party responsible for conservation outcomes and will be able to undertake legitimate land clearing and management activities unhindered. The environment will benefit from significant new investment focused on priority threatened species and priority conservation areas.
Comment
As the EDO points out:
There are no clear environmental baselines, aims or targets. There is no ban on broad-scale clearing, no mandatory soil, water and salinity assessment, and no ‘maintain-or-improve’ standard to ensure environmental outcomes – either at the site scale or at the landscape scale. Provisions are less stringent, less evidence-based, less accountable, and are likely to result in significant clearing increases in NSW.
The government has made no attempt to quantify the extra amount of land clearing that is likely to occur.
Vale Hugh Roberts

Former NSW Crown Solicitor, Hugh Roberts, was treasurer of STEP from 1996 to 2001. In this period STEP began its biggest ever publications fling, turning itself almost into a small business with the release of the Lane Cove bushwalking maps. The calm and business-like way Hugh carried this extra load was inspirational and made it so much easier for the rest of committee to get on with what each did best. In the complex world of environmentalism in an urban setting, it was comforting also to be assured of his wisdom during the many land versus environment conflicts that went on around us.
Hugh was for many years on the board of Australia's preeminent classical and contemporary a cappella group, the Song Company, and was also a long-time amateur classical pianist and ensemble musician himself.
He was a great guy, so easy to deal with and work with, and with his musical skills and his intense interest in all things environmental, legal and political, he was the nearest thing to a Renaissance man that STEP committee has been blessed with.
When Hugh knew beyond reasonable doubt that he was afflicted by Alzheimer's, friends and family obviously hoped and prayed that the doctors and specialists could be wrong. But he somehow knew the inevitability of the diagnosis and calmly accepted and dealt with it as best he could.
STEP's fond thoughts, memories and condolences go especially to his wife, Hilary, and also to his friends and to the many other members of his family. We shall miss him.
By John Martyn
Thirlmere Lakes, Perhaps another Victim of Longwall Mining
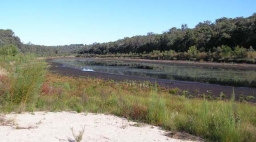
The previous issue of STEP Matters 185 described the risks to Sydney’s water catchment in the Illawarra region from longwall mining. Research is now pointing to mining also being a culprit in the drying out of Thirlmere Lakes. Thirlmere Lakes National Park is part of the Blue Mountains World Heritage Area. The two largest of the five lakes are currently empty and the other three are depleted.
The report, published by the UNSW Centre for Ecosystem Science, found that the dropping of water levels coincided with the onset of longwall coal mining in the mid-1980s, with the lakes having continued to dry out since then. Longwall coal mining is thought to have fractured the aquicludes that constrain the groundwater aquifers, causing diversion of groundwater resources. Another factor could also be considerable pumping of groundwater.
The report's findings contradict a 2013 NSW Government Commission of Inquiry which stated that:
… changes in the water levels in Thirlmere Lakes over the past 40 years are due to climatic variations such as droughts and floods.
The recent heavy rain that has led to nearby Warragamba Dam almost overflowing has had very little impact on the water levels in the lakes.
Commenting of the report, UNSW wetland ecologist Prof Richard Kingsford said gum trees were encroaching on the dry lakes. ‘What we are seeing here in terms of the vegetation is the slow death of a wetland,’ he said.
The Thirlmere Lakes are the 15-million-year-old remnants of a river whose original flow direction was stalled and gently reversed by mild tectonic tilting, and according to Prof Kingsford, hold a rich geology. The implications are significant for the ecological character of the Thirlmere Lakes.
There are many affected obligate aquatic species or species reliant on wet habitats, including:
- five species of waterbirds (Australasian Bittern Botaurus poiciloptilus, Australian Painted Snipe Rostratula australis, Great Egret Ardea alba, Cattle Egret Ardea ibis and Latham’s or Japanese Snipe Gallinago hardwickii)
- one fish species (Macquarie perch Macquaria australasica)
- two frog species (giant burrowing frog Heleioporus australiacus, Littlejohn’s tree frog Litoria littlejohni)
- three plant species (smooth bush pea Pultenaea glabra, Kangaloon sun orchid Thelymitra Kangaloon and the aquatic water shield Brasenia schreberi) that are listed as threatened
Interestingly, Thirlmere also carries the freshwater sponge Radiospongilla sceptroides.
The report has serious implications for governments and their responsibilities for managing the values of Thirlmere Lakes National Park along with the Blue Mountains World Heritage Area. These major changes in flooding regimes to Thirlmere Lakes will continue to degrade the Thirlmere Lakes National Park and its ecological, cultural and recreational values. The lakes were once popular with swimmers and canoeists.
Mine owner, Glencore announced in June that operations will be reduced and the mine will be closed in 2019 as a result of low coal prices. The local Wollondilly Council and Friends of Thirlmere Lakes are calling for action to restore the Lakes. Council has suggested that artificial injection of fresh water should be considered. It is a theory supported by groundwater expert Dr Philip Pells, who said recovery of the water table may otherwise take decades.
‘It's not beyond the realm of possibility to pump water up from Warragamba Dam, cycle it back through here, and it goes back down to Warragamba Dam,’ Dr Pells said.
Senate Committee Recommends a Ban on Plastic Bags – Can this Happen?

Good news, a container deposit scheme is going to happen. The NSW Premier announced on 8 May that a scheme based on the Boomerang Alliance’s proposal would be introduced on 1 July 2017. Mike Baird claimed this would be a world-class scheme. The ACT will use the same scheme and Queensland could be on board as well.
This decision will be a major step in reducing the volume of plastic pollution that ends up in our waterways and oceans. The other major source is single use plastic bags. We wrote about this issue in STEP Matters Issue 182.
The Australian government is aware of the problem. On 18 June 2015 the Senate referred the following matter for inquiry and report by April 2016 by the Standing Committee on Environment and Communications.
The threat of marine plastic pollution in Australia and Australian waters, with particular reference to:
- the review of current research and scientific understanding of plastic pollution in the marine environment
- sources of marine plastic pollution
- the impacts of marine plastic pollution, including impacts on species and ecosystems, fisheries, small business, and human health
- measures and resourcing for mitigation
In their report the committee noted that, while there may be the lack of rigor of some of the estimates of the amount of plastic in the marine environment (after all it can only be calculated using some sort of sampling process) they are still sobering: five trillion plastic pieces on the surface of the oceans; eight million tonnes of plastics leaking into the ocean every day – that is the equivalent of one garbage truck of plastic every minute of every day of the year.
Not only is this volume of plastic a significant threat to the health of marine life. The committee was considerably alarmed to hear that the potential effect on human health from the ingestion of microplastics in the food chain is only now emerging as an area of research interest. The committee is concerned that there may be a looming health crisis associated with seafood consumption, and urges the prioritisation of research on this issue, and appropriate investment from both government and industry. The committee also considers that microplastics warrant specific focus in strategies aimed a mitigating the effects of marine plastic.
The report called for state and territory bans on plastic bags, an immediate ban on microbeads and the introduction of container deposit schemes across the country by 2020.
There are still many unnecessary waste issues to be addressed such as the so-called flushable wipes that clog up sewerage systems and take away coffee cups. Most of these changes require a change of mindset. The environment needs to be given more priority than convenience.
Recycling Scheme for Paint – PaintBack

Australians buy more than 100 million litres of paint each year but around 5% of it ends up as waste, making paint and its packaging one of the biggest source of liquid waste into landfill. Paint contains chemicals such as volatile organic compounds and metals that can contaminate our groundwater and endanger human health. It is important to not put these items into your garbage bin.
Currently householders can take their leftover paint to collection centres set up every six months or so by local councils. Often the Clean Up Day is missed. Meanwhile the old paint tins accumulate in the storage sheds. The alternative is waste collection centres but they cost about $4.50 per litre tin, no matter how full.
A world first program, called Paintback, has been launched recently to offer professional and home painters an easy option for disposing of unwanted paint and packaging correctly. It expects to keep more than 45,000 tonnes out of landfill over the next five years.
To fund it, the paint manufacturers will add 15 cents a litre to the wholesale price of their products. There will be no further charge for anyone to dispose of paint at any designated collection point.
Paintback, a not-for-profit company, has ACCC regulatory approval to apply the waste levy and the support of Australian, state and territory governments. States and Territories have agreed to amend environmental regulations to allow trade painters to use the same scheme as DIY painters.
About 70 paint-specific collection points will be established over the next two years – starting with 12 in capital cities through a partnership with Cleanaway, which provides the expertise and a significant national footprint to collect and treat the waste paint and packaging. Existing council waste management centres also will be invited to participate.
The industry will fund research to find better uses for unwanted paint. Uses for waste paints could include extracting fossil fuels for energy consumption. The steel and plastic packaging is also recycled into new products.
Interesting Discovery during Agnes Banks Walk

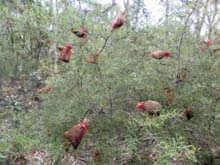 During the STEP walk at Agnes Banks Nature Reserve we came across an endangered Persoonia nutans with lots of little gauze bags tied over the flowers. This is a beautiful delicate plant but it occurs in limited locations. I happened to listen to an episode of ABC Radio National program Off Track that actually described what the bags are all about.
A major population of P. nutans is the one at Agnes Banks, though there are a few others, notably at Castlereagh Nature Reserve and the Georges River area. But all its localities are isolated and have been threatened by past land clearing, sand mining and development.
Currently researchers have difficulty propagating the plant and it has been impossible to germinate the seeds. Research is currently being undertaken by the Australian PlantBank in order to establish a viable emergency genetic supply of seeds. Ideally, if the plant could be propagated, it could be used in habitat restoration and landscaping.
In the radio program, Technical Officer Katharine Catelotti describes the work being done on this plant. Especially intriguing are the seed collection and germination experiments using smoke, heat, fungus and processing through the emu’s digestive tract. As emus are known to eat their scats so they are testing whether the seeds need to go through their system more than one time.
Battle to Preserve the Byles Creek Wildlife Corridor
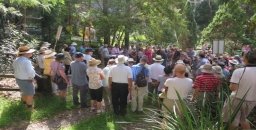
Beecroft is bearing the brunt of three significant infrastructure developments (North West Rail Link, Epping to Thornleigh Third Track and NorthConnex road tunnel) as well as unit development. These projects have led to the removal of many significant trees including 0.7 hectares of Sydney Turpentine Ironbark Forest which is listed as endangered.
The residents of Malton Road and the Beecroft-Cheltenham Civic Trust have been fighting for many years to save bushland at 79–87 Malton Road from subdivision. If the subdivision application is approved the last remaining corridor of bushland along Byles Creek between Lane Cove National Park and Pennant Hills Park will be lost. It is one branch of Byles Creek that is largely unaffected by urban runoff and it is rare to find such pristine water in urban areas.
The land is in excellent condition, holding high biodiversity values as recognised by its inclusion on Hornsby Shire Council’s Biodiversity Map, with habitat supporting a range of threatened flora and fauna species including Leptospermum deanei, Genoplesium baueri, the grey-headed flying-fox, Powerful Owls and an endangered population of Gang-gang Cockatoos of ‘significant conservation value as it is the last known breeding population of the species in the Sydney metropolitan area’.
If the land is built on, the bushfire regulations will require most of the blocks to be cleared to create asset protection zones. It is unclear whether all six blocks could be built on in any case because of access and asset protection issues. So it could be that most of the area of bushland would be cleared for construction of only two or three houses.
At the June 2015 Hornsby Council meeting following extensive resident addresses and debate, councillors voted unanimously to make a full and comprehensive submission to the NSW Government to acquire this bushland as regional open space. Members of the Byles Creek Valley Union and Civic Trust members worked hard to compile a comprehensive submission to the NSW Government, to augment that prepared by council.
In December the deferred application was refused by council on the grounds that the ecological assessments provided by the applicant were inadequate. Precise confirmation is needed of the possible presence of two plant species: the vulnerable Leptospermum deanei and the endangered Genoplesium baueri, an orchid. It would not be known until March – when the orchid flowers – whether it grows on the site.
The applicant has not been prepared to obtain extra information about this orchid and the applicant then appealed the decision before the Land and Environment Court.
A report commissioned by council by ecological consultant Peter Smith stated the entire site:
… is worthy of purchase and management as a bushland reserve ...
If funding is not available to purchase the land, then further assessment is needed of the impact of the proposed subdivision and residential development of this land …
A patch of bushland like this, with so many large, old trees, forms a crucial piece of habitat for so much of our biodiversity and its loss would be a loss for the community and Sydney as a whole …
He also questioned whether offsets are available in respect of the land to be cleared.
On 10 March a conciliation conference was held on site. Over 100 local residents arrived on a very steamy morning to hear very detailed oral submissions from four local residents explaining their reasons for opposing the application.
Further negotiations are going on via the Land and Environment Court conciliation process. This is due to be finalised on 6 May.
The residents are still fighting with all their might. They are pushing for the proceeds from the council sale of a church hall in Cheltenham to go towards purchasing the land. See www.2119.org.au for the full story. The group has also created a Facebook page for Mikey the Powerful Owl that is frequently seen in the valley.
Please write to the Hornsby councillors to express support for acquiring the land so this precious bushland can be preserved.
Bushwalking Booms as Participation Nearly Doubles

Interesting consumer research has found the number of Australians going bushwalking has risen significantly in the past five years.
Findings from Roy Morgan research shows that between October 2010 and September 2015, the proportion of the population over the age of 14 who reported going bushwalking at least occasionally has almost doubled from 15.6% to 27.3% – a total of 5.3 million Australians. That is a lot of people.
The information was gleaned by a survey conducted by the reputable consumer research organisation, which asked respondents about how often they go bushwalking, and what they did on their last holiday.
Self-reported regular or occasional bushwalkers were shown to be more likely to visit wilderness locations, as well as undertake other outdoor adventures. I got in touch with researchers at Roy Morgan and they kindly provided state specific information that shows South Australia saw the greatest increase in bushwalkers over the period, while Tasmania has the highest rates of participation overall.
Most importantly, it seems the trend towards an increasing interest in bushwalking holds true across the country.
From personal experience, I’ve seen walks near my home in NSW increase in popularity in recent years, with one route in particular jumping from up to 15 walkers on a good Saturday to now closer to 80. There have also been some incredible increases in the number of people on a few specific walks in Royal National Park, but these are big outliers and unsustainable increases rather than the slow and steady growth we might hope for.
This growth is also visible online and in community groups that are closely affiliated with bushwalking. I’ve seen a clear increase in participation in recent years on bushwalk.com and wildwalks.com.
But this seems to be leading to more people presenting as under-prepared for the adventures they’re undertaking. I’ve come across more walkers without an adequate map or relevant details for the route they’re on. This is a worrying trend and I hope that as more experienced members of the bushwalking community we can assist beginners whenever and wherever they need the help. Equipping people new to walking should be a priority, not only for the health and safety of new bushwalkers, but also to try and minimise their impacts on the parks, tracks, flora and fauna they interact with.
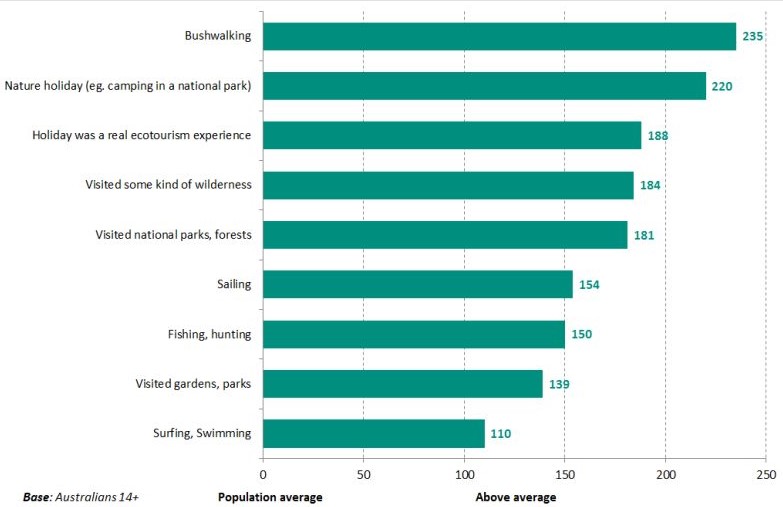
What hikers/bushwalkers did on their last trip compared to the average Australian
(from Roy Morgan’s latest findings on the holiday habits of Australians)
Related Industries to Benefit
The overall result of this increase in bushwalking participation will have knock-on effects for the businesses that are closely related to the activity, especially for information services such as Wild.
Cafés and other businesses near walking tracks should also enjoy an increase in walkers, which would be a great win for the edge of suburbs. Hopefully the number of people enjoying a day walk will also graduate into multi-day hikes, and they’ll do so with the help of guides and tour operators. This is the good news Roy Morgan Research wants to communicate, with group account director, Angela Smith saying the apparent boom in bushwalking represents ‘a wonderful opportunity for savvy tourism operators and destination marketers’
‘Not surprisingly, destinations offering scenic wilderness hold greater appeal for hikers and bushwalkers than for the average Australian considering a holiday. When asked where they’d like to visit, this group showed an above-average preference for unspoiled regions such as Freycinet National Park, the Flinders Ranges, Cradle Mountain and Lord Howe Island,’ she said.
If this graduation process occurs then the adventure-specific retailers and clubs should also start to see a marked increase, but it may be too early to see these effects taking place. Also, given the popularity of online retail and community groups, the benefit to traditional organisations will no doubt be a little muted.
We need to be careful that we don’t love these special places to death. Hopefully the most significant change will be for parks and reserve management, otherwise the increase in participation will have adverse impacts on the environment. In NSW, we have seen some walks become over-the-top popular, going from just a few walkers per day to sometimes as many as 1000. Many of these bushwalkers are inexperienced and not aware of potential risks to themselves and the bush. This is not the norm, but show the impact social media can have in encouraging people to adventure, a lesson and warning.
Keeping Bushwalking on Track
Since we are now talking about nearly 30% of the population participating in bushwalking (more than golf, competitive sports, and cycling) it is time to start doing some solid research.
We need to better understand where people are walking, how they use the track networks, how often they return, walking speed, direction of travel, group sizes and so on. Much of this is easy data to collect and will help in better planning, equipping and promotion.
We can better understand how people are using walking tracks now, I am confident that we can plan for a future where even more people are walking, where we maintain a sense of wilderness and look after these precious areas. To do this we need to stop making assumptions and get some real data that can inform planning.
Unlike golf and cycling, the cost of entry to bushwalking is much lower for most popular short walking tracks. Gear suppliers have done a wonderful job at producing lightweight gear for experienced walkers. A challenge for the industry will be to find ways to provide products and services of interest to all these new bushwalkers, again the challenge would be made easier if we can better understand how, when and where these people are walking.
In the meantime, at least we know our national pastime is more popular than ever.
Our thanks to Matt McClelland for permission to republish this article. It was published in Wild on 17 February 2016.
Bushwalking Proposal for the Shoalhaven
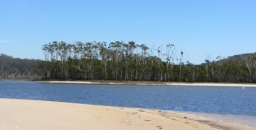
A group of people living in the Shoalhaven region have seen the potential of the bushwalking boom.
The Shoalhaven region is an ideal area to promote bushwalking. There is a multitude of choices ranging from beach walking to coastal bushland with lovely lagoon views, and inland there are the spectacular Budawangs. Most of the walking possibilities are in national parks such as Morton, Murramarang and Meroo.
There are already many towns, caravan parks and camping areas which provide an extensive choice of accommodation. Strangely the area does not seem to be very well known so it is very quiet outside the warm weather holiday periods.
A proposal has been developed by the recently formed Shoalhaven Bushwalking Advisory Group which has a membership from right across the Shoalhaven and includes Shoalhaven Bushwalkers and Milton National Parks Association. The group represents a wide spectrum of interests including bushwalking, cycling, kayaking and bird watching. The group is united by a desire to protect and preserve the unique natural environment of the Shoalhaven while encouraging minimal impact recreational access to this remarkable area. Former STEP president, Barry Tomkinson is a member of the group.
This proposal outlines an opportunity to develop sustainable walking tourism, thereby promoting the beautiful natural environment as a year-round national and international iconic walks destination.
Walking tourism has the potential to extend the existing peak season and smooth the influx of visitors over the entire year. This has obvious advantages for infrastructure planning but also ensures that local businesses have more predictable revenue throughout the year, rather than the current boom and bust cycle.
Research demonstrates that for every $1 spent establishing and maintaining walking tourism facilities, as much as $600 is generated for the economy of the region.
However, significant evidence exists to indicate that visitor access to bushwalking and other minimal impact visitor experiences is constrained by a lack of readily available information and coordinated visitor support services, and poorly signed and maintained tracks and access points.
The group’s proposal is for a series of iconic walks to be developed and promoted to position Shoalhaven as a national and international walking destination.
The proposal will commence with work to brand, improve facilities and promote the Southern Shoalhaven Coast Walk, a 40 km walk from Narrawallee Inlet to Merry Beach. The project will act as a pilot for a new, collaborative approach to walking tourism development in the Shoalhaven.
Longwall Mining in Sydney’s Water Catchments
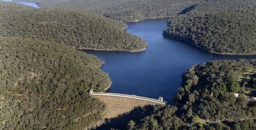
The battle continues against coal mining under the water catchments in the Illawarra but there are some hopeful signs that the NSW Government could start to see sense about the environmental damage that is occurring.
Sydney is fortunate to have a pristine water supply on its doorstep. In theory the water catchments are protected as development and agriculture are prohibited. In the Special Areas in the Illawarra catchment anyone entering the land without permission can be fined $44,000. These catchment areas contain bushland and natural systems such as coastal upland swamps that slow water movement and filter the water that flows into dams such as the Avon and Cataract. Many other cities have to pay millions of dollars to operate synthetic filtering systems of their water supply.
Mining has been undertaken in the Illawarra region since the 1880s but in the early days the methods used were pick and shovel and later machinery that took out small sections of the coal seam. The mine ceilings and walls were supported by the bord-and-pillar method. Since the 1960s the technology for longwall mining has been developed that vastly increases the rate of removal of coal and, incidentally, cuts the level of employment significantly.
The coal is removed by a massive machine that shears away the wall beside it whilst hydraulic powered supports hold up the roof. As the coal is removed, the machine supports are moved forward and the roof is collapsed behind them. The areas of rock extracted are 150 to 400 m wide, 4 m high and can extend for several kilometres. When one longwall is completed another is started leaving a rock support of about 50 m in between.
As such a large section of coal is removed the roof above the longwall collapses. Depending on the nature of the rock above, minor cracking can occur in the strata above, but frequently major cracking has occurred right up to the surface. Cracking leads to water leaking from the creeks and wetlands, pollution from the release of excess minerals from the underlying rocks and cliff falls.
Concerned locals have been documenting the damage over the past ten years and have been leading a campaign to raise awareness of the damage and making detailed submissions explaining the concerns about current and future development applications. This group was formalised by the creation of the Protect Sydney’s Water Alliance in 2013, a network of more than 50 community groups from across Sydney, the Illawarra, Southern Highlands and Blue Mountains.
Illawarra Mines
The Illawarra mines all produce coal for steel making. They make up a complex array of cavities under a region that has reliable rainfall and therefore is a significant source of drinking water for Sydney as well the large population of the Wollongong region. The main miners are:
- Wollongong Coal Ltd, listed on the ASX but majority owned by Indian company Jindal Steel and Power, with mines at Russell Vale near Cataract Dam and Wongawilli further south. The Russell Vale mine has run out of approvals. The Wongawilli mine was suspended but the company has now applied to extend its licence and reopen the mine.
- Illawarra Coal owned by South32, a company demerged from BHP that operates the Dendrobium mine near the Avon Dam.
- Peabody Energy operates the Metropolitan mine near the Woronora Dam.
There are two current controversial applications for extension of current mining operations.
Wollongong Coal
In Issue 180 of STEP Matters we wrote about the Planning Assessment Commission’s (PAC) report on the application to develop eight new longwalls. Wollongong Coal failed to convince PAC that it can expand the Russell Vale colliery without causing substantial and irreversible damage to Sydney’s drinking water supply.
As the mining approvals have run out the mine was closed six months ago, and the entire workforce was sacked. But the company seems undaunted and has continued with the expansion application.
The second review of the mine expansion by PAC has just been released and has reinforced the previous opinions. Despite acknowledging the short-term benefits of the project – which includes the provision of 300 jobs for five years, about $23 million in royalties to the NSW Government and $85 million in capital expenditure and other direct and indirect flow-on effects – PAC concluded that:
On the basis of the information provided, the Commission is of the view that the social and economic benefits of the project as currently proposed are most likely outweighed by the magnitude of impacts to the environment.
In particular, PAC identified the risk of water loss, risk to upland swamps, noise impacts on nearby residents, potential hydrogeological impacts and a loss of ecosystem functions.
PAC is not satisfied that the project is consistent with the State Environmental Planning Policy (Sydney Drinking Water Catchment) 2001 that it would have a neutral or beneficial effect on water quality in the catchment area. The magnitude of water loss is uncertain with the projected range from the proponent and Water NSW varying from minimal to 2.6 GL/year. PAC considers this is a high risk situation. Sydney Water has valued the potential water loss at a cost of $23 million over 25 years. The cost of government subsidies are also estimated to be $23 million. The expansion is economic as well as environmental madness.
A separate issue is the financial viability of the company itself.Wollongong Coal currently has no capacity to repay its debts unless it is thrown another financial lifeline by parent Jindal Steel & Power (Australia) Pty Ltd. The company is currently suspended from trading on the Australian Stock Exchange. If the project falls over the company has no capacity to remedy any damage it could cause to the catchment.
Under legislation passed in 2014 in response to ICAC findings the Minister for Resources can deny a mining application if the proponent is not deemed to be ‘fit and proper’. The Environmental Defenders Office has presented a strong portfolio of evidence that Wollongong Coal fails that test. The minister’s response is so far non-committal. This is the first time a decision is being made under this legislation so it may take a while to consider the precedent it may establish.
The final decision is in the hands of the government.
Dendrobium Mine
The Dendrobium Mine was approved in principle by a Planning Assessment Commission in 2001 and significantly expanded in 2012 despite great concern to those watching the significant damage that had already occurred to every swamp that was above an existing longwall.
The company is now applying for a further expansion closer to Avon Dam. Protect Sydney's Water Alliance objected to the expansion for several reasons:
- proven ongoing damage caused by current longwall mining
- failure by the proponent to take any steps to mitigate damage to swamps in previous longwalls
- failure by the proponent to prove that swamps can be rehabilitated or to undertake agreed research in this area
- the Dam Safety Committee clearly states in its submission that no longwall mining should take within 300 m of the full supply level of Avon Dam (the proposed longwalls will be within 250 m of the dam)
- the cumulative Impact of this mining on the catchments over the long term (as per PAC 2016 rejection of Russell Vale expansion)
- the dubious nature of jobs claims and the lack of any evidence that royalties or bond can ever cover the cost of rehabilitation
The closing date for submissions is 15 April. Click here to make a submission.
Metropolitan Mine
This mine was given approval for major expansion in 2009 despite major damage already occurring to the Waratah Rivulet and failed attempts to remediate the cracks using polyurethane resin injections. Peabody Energy is currently in financial straits because of the fall in the coal price. However, it is expected that the company will apply for a further expansion in the near future.
Significance of PACs Wollongong Coal Report
The issues raised in the PACs report apply to all the other mines in the catchment. It is hoped that heed will be taken of the strong opinions of the report when the current expansion plans of the Dendrobium and, possibly, future Wongawilli and Metropolitan mine expansion applications are considered.
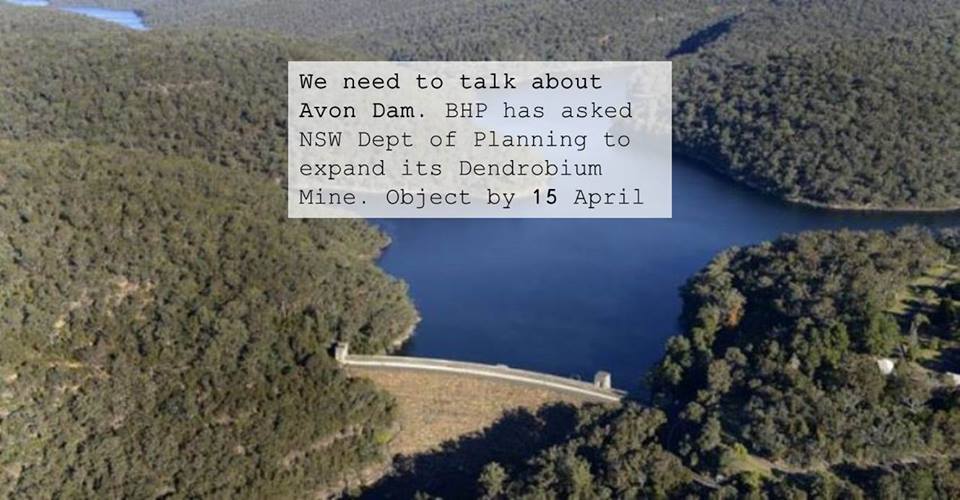
Great Barrier Reef in Peril but Adani Mine Approved
At the end of March aerial surveys of more than 500 coral reefs from Cairns to Papua New Guinea revealed that the most pristine sections of the Great Barrier Reef are currently experiencing the worst, mass bleaching event in its history, with the overwhelming majority of reefs (95% has been quoted) being ranked in the most severe bleaching category.
Bleaching is caused by abnormally warm sea temperatures that have been boosted by the El Niño event that commenced in mid-2015 leading to sea surface temperatures more than 1°C above normal. These conditions are predicted to occur more frequently and more severely as greenhouse gas concentrations in the atmosphere increase.
As ocean temperatures have not cooled down yet in the northern section it is too early to tell what the long-term implications of this event will be. This depends on how soon ocean temperatures reduce and the time before another event occurs. Reefs need about ten years to recover.
The Great Barrier Reef has experienced mass coral bleaching events in the past. In 1998, there was a global mass bleaching event where 50% of the reefs on the Great Barrier Reef were affected. During this time, sea temperatures on the Great Barrier Reef were the highest ever recorded. Mass bleaching also occurred in 2002, with 60% of reefs were affected. This was the largest coral bleaching event on record.
In both the 1998 and 2002 events, the vast majority of corals on the reef survived, as sea temperatures came back down again in time for them to recover. About 5% of the Great Barrier Reef’s coral reefs experienced coral die-off in both these events.
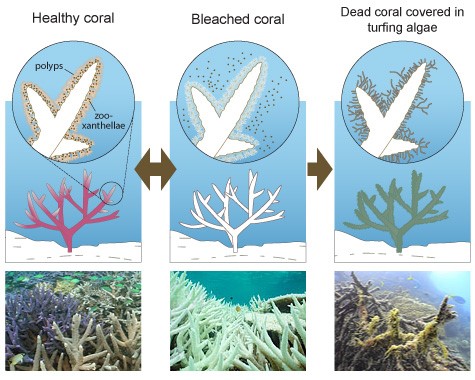 What is Coral Bleaching?
From www.globalcoralbleaching.org
Many types of coral have a special symbiotic relationship with a tiny marine algae (zooxanthellae) that live inside corals’ tissue and are very efficient food producers that provide up to 90% of the energy corals require to grow and reproduce.
Coral bleaching occurs when the relationship between the coral host and zooxanthellae, which give coral much of their colour, breaks down. Without the zooxanthellae, the tissue of the coral animal appears transparent and the coral’s bright white skeleton is revealed. Corals begin to starve once they bleach. While some corals are able to feed themselves, most corals struggle to survive without their zooxanthellae.
If conditions return to normal, corals can regain their zooxanthellae, return to their normal colour and survive. However, this stress is likely to cause decreased coral growth and reproduction, and increased susceptibility to disease. Bleached corals often die if the stress persists. Coral reefs that have high rates of coral death following bleaching can take many years or decades to recover.
Global Coral Bleaching
In 1998, a huge underwater heatwave killed 16% of the corals on reefs around the world. Triggered by the El Niño of that year, it was declared the first major global coral bleaching event. The second global bleaching event that struck was triggered by the El Niño of 2010. The US National Oceanic and Atmospheric Administration announced the third global bleaching event in October 2015 and it has already become the longest event recorded.
The new phenomenon of global coral bleaching events is caused by ocean warming (93% of climate change heat is absorbed by the ocean). Corals are unable to cope with today’s prolonged peaks in temperatures – they simply haven’t been able to adapt to the higher base temperatures of the ocean. Although reefs represent less than 0.1% of the world’s ocean floor, they help support approximately 25% of all marine species. As a result, the livelihoods of 500 million people and income worth over $30 billion are at stake.
What can be done?
A major global bleaching event is considered one of the most visual indicators of climate change. Clearly the current experience demonstrates the importance of taking action to reduce greenhouse emissions. Apart from the potential loss of thousands of jobs in the tourism sector future generations could miss out on experiencing this environmental masterpiece. In the face of this situation the announcement on 3 April by the Queensland Government of the go ahead for the development of the largest coal mine in Australia is hard to fathom.
Adani’s own figures are that the mine and the burning of the mined coal will emit more than 4,600 Mt CO2 over its 90 year lifetime. The Australia Institute has estimated that average annual CO2 emissions will be 79 Mt. Australia’s current annual emissions are around 600 Mt. Many conditions have been placed on the mine and port operation aimed at limiting direct environmental damage but nothing can be done to stop the long-term damage from burning the coal.
There is still some legal action being taken by the local Aboriginal land owners and the Australian Conservation Foundation is taking action based on Australia’s commitments under the world heritage convention, which dictates Australia ‘do all it can to the utmost of its resources to identify, conserve, present and transmit to future generations the outstanding universal value of the Great Barrier Reef world heritage area’ – and that this must be the primary purpose of management of the area.
It says Environment Minister Greg Hunt ‘made an error of law’ by characterising emissions from transport by rail, shipping and then the burning of the Adani coal overseas as ‘not a direct consequence of the proposed action’.
The other hope for stopping the mine is that the falling price of coal will risk the financial viability of the coalmine so that bank finance will be unavailable. Dredging of the port at Abbot Point cannot commence until finance is secured.
Will Driverless Cars be Good for the Environment?

Technological developments have had profound impacts on our lives, some good and some not so good, some with immediate benefits but unforeseen damage in the longer term. The internal combustion engine has transformed our lives from the horse and buggy era to almost total dependence on the use of motor cars.
Motor cars dominate our land use because of the need for roads, parking, service stations, car retailers etc. There is the health cost of fossil fuel particulate emissions and transport is a major contributor to greenhouse gas emissions. There are pollution and social costs from the inefficiencies and stress caused by congestion.
There is currently some debate about the effects of driverless (autonomous) cars. I will leave discussion of the economic effects such as changes in employment to the experts. Here are a few of the arguments for and against driverless cars from the social and environmental point of view. I am interested in hearing your views.
Reduction in Congestion
One of the chief arguments in favour of driverless cars is that they will lead to more efficient use of roads. Driverless cars could communicate with each other and traffic management systems and permit greater numbers of cars to get through a particular stretch of road. This is hypothetical in that it hasn’t been proven with real-world traffic and real driverless cars yet, but it has been well modelled, and there is little reason to doubt that in general this is true.
Driverless cars, it is believed, won’t get in accidents with anything like the frequency or severity of human-driven cars. This will reduce overall congestion, as well as death and injury, personal and financial costs.
Vehicle Efficiency
It is believed that most urban driverless taxis, and perhaps private cars, will be fully electric for reasons that are not primarily environmental.
Electric motors offer safety advantages (they can be used for emergency braking and to some degree for emergency steering). They are also much more durable (an electric motor easily lasts 1 million kilometres), less expensive and less complex than conventional engines. (Currently the reason for the high cost of electric cars is the expense of batteries.) In addition some driverless taxis operating in local traffic, primarily during peak hours, will not need huge battery packs. During idle times they can drive themselves to the next high efficiency charging station as needed.
There can be no doubt that driverless taxis and buses can change the nature of urban mobility. Much more short-distance travel will occur in small, lightweight, extremely energy efficient driverless taxis. Although this may lead to an increase in total miles travelled, the following effects combine to reduce greenhouse gas emissions because driverless taxis will:
- be mostly electric which reduces carbon emissions (provided the electricity comes from renewable sources)
- be smaller and much lighter than the average car which further reduces energy consumption per kilometre
- reduce demand for private cars and the total number of cars and therefore reduce the sizable greenhouse gas emissions during vehicle manufacturing which are typically more than 10% of total life-cycle emissions of a car (according to some estimates, a self-driving car-sharing vehicle or taxi can eliminate seven to ten private cars)
- facilitate multi-modal travel (taking a taxi to the train or bus station, continuing with bus or train)
More Efficient Use of Cars
How will driverless cars change the way we get around? The future may not be in private ownership but in mini-buses and taxis. The response of individuals is hard to predict.
Already there is a trend for people living in inner city areas where there is good public transport to forgo private car ownership. Car sharing services such as GoGet and internet call up services such as Uber are available to meet short-term needs.
Carpooling has been touted for decades as a way to use cars more efficiently. But it never took off because it suffered from an information problem: There was no way to know whether someone living around the corner was heading in the same direction as you, right this instant. It is much easier to drive yourself so many of us head off to work in the same direction with one or two people on board.
At the level of urban design and the environment, driverless cars could produce huge benefits. If cars can drive themselves, fleets of them could scurry around picking people up and dropping them off, working with sleek, robotic efficiency. With perfect computerised knowledge of where potential riders were, they could pick up several people heading the same way, optimising ride-sharing on the fly.
It’s possible that fleets of robocars could become so reliable that many people would choose not to own cars. The reduction in private use of cars could reduce the need for parking. Think of all that land that could be freed up and converted to recreation and green space.
Social Benefits
Driverless cars could enhance the lives of the disabled and older drivers by giving them greater independence although they may still need assistance at either end of their journey.
Questions
The effect of driverless taxis on public transport is not yet clear. There is both the risk that some local trips which are taken by public bus today will migrate to driverless taxis and the opportunity to capture a much larger share of the mobility demands with on-demand buses and mini-buses will not eventuate.
There has been talk of the nirvana of being able to call up your driverless car and, hey presto, your car will appear and take you to work or the shops, take your children to sport or pick them up from the late night party. You will be able to sit in the car and catch up with the work emails or have a snooze. Internet taxis and ride share services cost less because they are more efficient in matching up vehicles and passengers. Costs will become even less if there is no driver to pay. Transport to work will be so enjoyable that people will happily live in the outer suburbs and travel times will not be an inconvenience.
But, just a minute, if one extra person is driven rather than taking public transport won’t lots of people want to do this? Congestion is a non-linear function, so as a road approaches its maximum capacity, small changes in traffic volumes can cause proportionately larger changes in congestion delays. We see this in practice where reduced traffic during school holidays makes a major difference to travelling speeds.
Driverless cars somewhat mitigate this effect, but that doesn’t matter if the use of driverless cars means more cars on the road at the same time. Further, ride shares have to drive further than someone in a private car would in order to pick up their customers or return to their designated drop off points. Completely empty driverless cars on the road are not likely to reduce congestion if more driving is required.
And that’s where the rub is with driverless cars. There are differences of opinion about how driverless cars will actually operate.
Will people stay attached to private cars?
Many people like having cars and use them as handy storage and goods movement facilities. Will they be willing to give up the convenience of having a car immediately on hand? They are status signifiers to neighbours. They are places of privacy. They are cars whose sunk costs are turned into travel conveniences, with weekend trips to the beach and annual holiday trips made economical by having a car for commuting.
While many automotive theorists predict radical changes in human behaviour related to car ownership, there’s little reason to believe that people will become rational just because of a new technology. There may be an impact on private vehicle ownership, but this may not be nearly as big as other advocates suggest. And if this is the case, then there is little reason to expect a reduction in total car miles driven and car ownership.
Will a reduction in family cars increase total mileage driven?
While in general there is little reason to believe that there will be substantial decreases in ownership, let’s explore that model in case it comes true. Let’s identify a model family of mother who works in the city, father who does piece work at home and two children in school. In this model, the family’s single driverless car delivers the mother to work, then swings back and takes the kids to school, then swings back and takes the father to a mid-day yoga class, then unspools this at the end of the day. This does take a two family down to a one car family. Except it does it by up to doubling the total miles driven by the family, as the car goes two ways. Once again, congestion is strongly correlated to total miles driven by cars, and in this model an empty car is driving around with no one in it a lot of the time and the total miles driven by the family vehicle go up. That is likely to increase congestion.
Will parking outside the city centre increase the total distances driven?
Right now people who drive to work park at or very close to work. That’s pretty useful because they have access to their vehicle and it stops driving once they reach their destination. Under one model posited for driverless cars, the car wanders away to cheap parking outside of the core. The problem with this is that it once again puts more vehicle miles on the car which is strongly correlated to increased overall congestion. Imagine a bunch of empty cars on the roads at rush hour trying to get through city streets to cheap parking. And then there is the land required to be allocated for more parking space.
Will longer commutes become viable and so increase the total distance driven?
At present, commuting by car is highly unproductive time. Commuting by public transport is also problematic due to lack of power outlets and Wi-Fi and the inability to have private conversations. There’s a model of the future, however, in which driverless cars provide a private productivity zone, allowing people to live even further from work. Driverless cars promoting suburban living and long commutes increases traffic congestion and fuel use.
Conclusion
Driverless cars have the potential to reduce transport land use, congestion and greenhouse emissions. Do you agree?
References
http://cleantechnica.com/2016/01/17/autonomous-cars-likely-increase-congestion
http://www.driverless-future.com
http://www.newsweek.com/driverless-cars-and-future-parking-418943
http://www.newsweek.com/2016/01/22/driverless-cars-and-future-getting-around-415405.html
Issues of Major Concern for NSW

The population of the Sydney metropolitan area is estimated to grow by 1.6 million people by 2031. According to the NSW Government, Sydney will need 664,000 additional dwellings by 2031. This dramatic expansion is being driven by the Australian Government’s insane promotion of high immigration in pursuit of its unsustainable growth agenda. The NSW Government’s response is A Plan for Growing Sydney.
Biodiversity Laws to be Rewritten
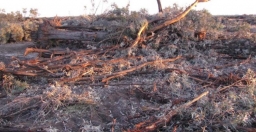
In STEP Matters, Issue 183, p4 (Concern about Changes to Biodiversity Laws) we explained the reasons for concerns about the NSW Government’s plans to rewrite the biodiversity laws. The new legislation is due to be released in March 2016 and the indications are that protections will be significantly weakened.
Expansion of Medium Density Housing

In the past, councils expended significant funds in formulating local environment plans with zoning locations appropriate for different areas. The particular zoning and its extent took into account the immediate and cumulative effects on local infrastructure, services, traffic, street car parking, social services and amenities. The matching development control plans gave consideration to the local character of the area, including streetscape, topography, shared views, and soils.
It now seems that the NSW Government is trying to overwrite these local powers by proposing a major expansion of medium density housing into low density housing areas. Details are provided in a discussion paper released in November 2015 called Options for Low Rise Medium Density Housing as Complying Development.
Forced Council Amalgamations

After promising that amalgamation would not be forced onto residents, the NSW Government is pressing ahead by moving the goal posts. Initially local councils needed to demonstrate to IPART that they were fit for the future. Then after the majority of councils did prove their financial fitness the Government imposed a minimum scale and capacity (population size) as the requirement.
Climate Change Implications for Local Bushland
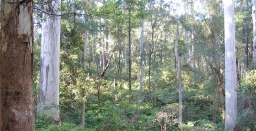
The Ku-ring-gai Bushcare Association is an unincorporated organisation that is supported by Ku-ring-gai Council which supports the Bushcare volunteer program and holds regular educational events. The committee comprises elected volunteers and Council employees.
Paris Climate Change Agreement
The Paris climate change talks in December 2015 produced an agreement hailed as 'historic, durable and ambitious'. Developed and developing countries alike are required to limit their emissions to achieve an objective of limiting average global temperature increases to 2°C with an aspiration of 1.5°C.
Hornsby Quarry Diatreme
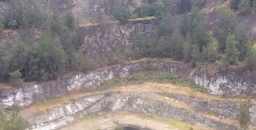
In November last year STEP held a talk by Dr Ian Percival on the unique volcanic diatreme that has been exposed in the Hornsby Quarry. The Geological Society of Australia and STEP made submissions to the Roads and Maritime Services about the project to use the quarry void to dispose of spoil from the NorthConnex tunnel. But while it appears that the upper two levels of the quarry will escape burial, so far we have seen little reference in any document to the enormous importance of this site as a scientific and educational tool.
More...
Prickly but Friendly Close Encounter

STEP committee member, Andrew Little, happened across an Echidna searching for ants in a driveway in Roseville Chase. It was a concern that he had open shoes without socks at the time and so stood perfectly still. He describes the experience.
We can Achieve Sustainability – but not without Limiting Growth

Mark Diesendorf, UNSW Australia
Can Australians be sustainable and enjoy endless economic growth? It’s not likely.
Beverage Container Deposit Legislation

The Boomerang Alliance, a coalition of groups led by the Total Environment Centre, has been campaigning for more than ten years for the introduction of a drink container deposit scheme to reduce the appalling level of litter, especially along our waterways and highways.
Hard Times for Flying-foxes in Sydney

Out thanks to the Ku-ring-gai Bat Conservation Society for permission to publish this article that was originally published in Friends of Bats newsletter in December 2015. It is written by Tim Pearson, a wildlife ecologist who is researching flying-fox communication for his PhD at Macquarie University.